Menu
Home
Topics
My Insights
About
Contact
Login
Get Started
Topics
My Insights
Login
Get Started
Years
>
Year 12
>
Statistics and Data
>
Create and Interpret Bar & Line Graphs (Histograms)
Create and Interpret Bar & Line Graphs (Histograms)
Try
VividMath Premium
to unlock full access
Start Free Trial
Create and Interpret Bar & Line Graphs (Histograms)
Video Quiz 1
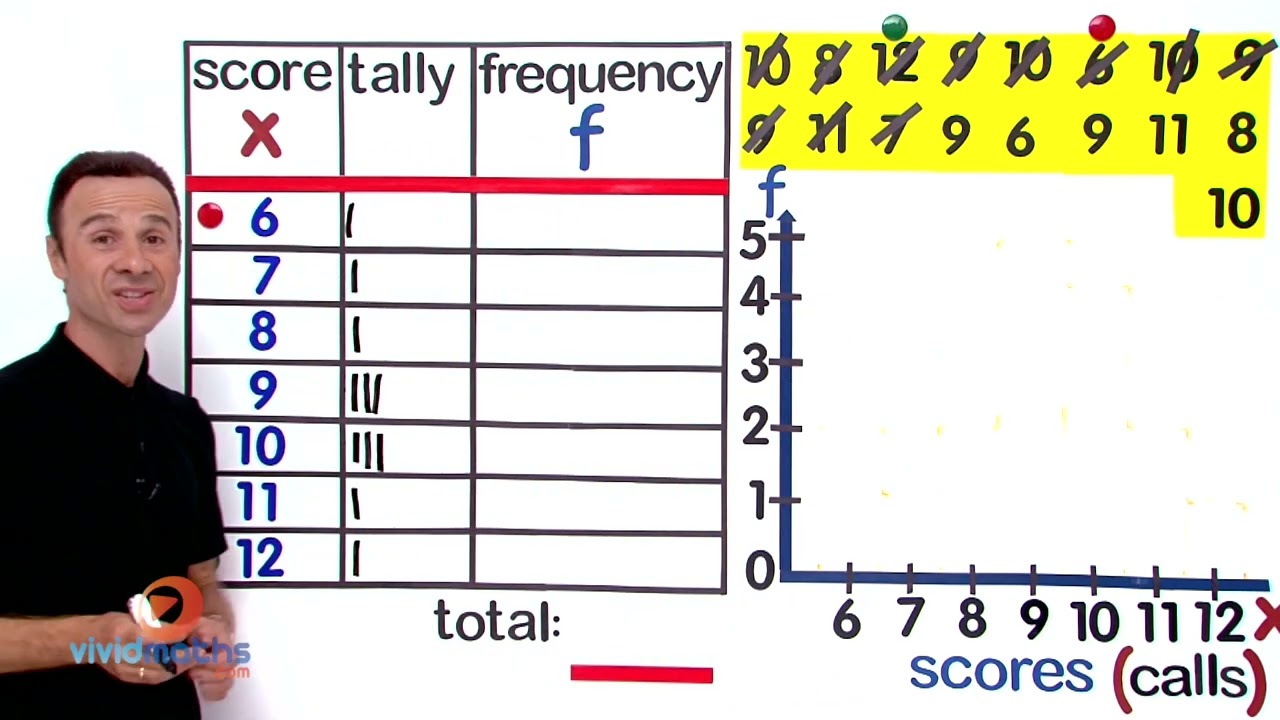
Create a Histogram from a Set of Scores #1
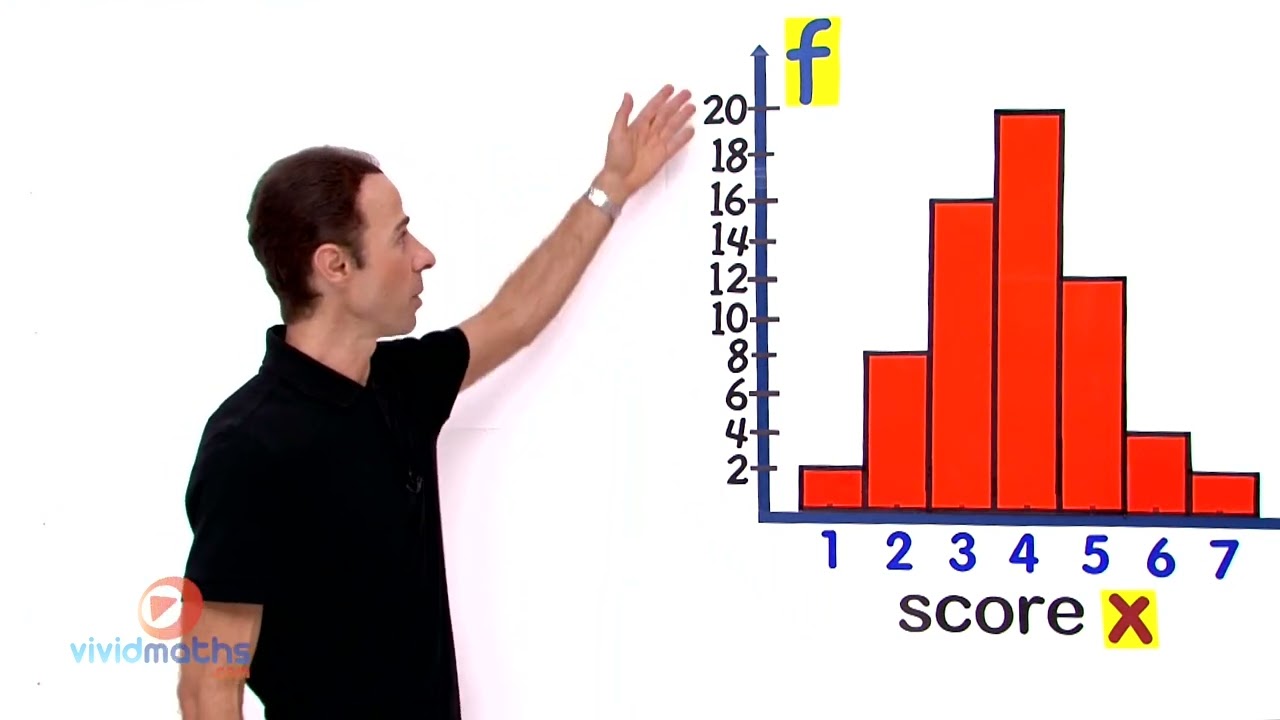
Find the Mode from a Histogram #1
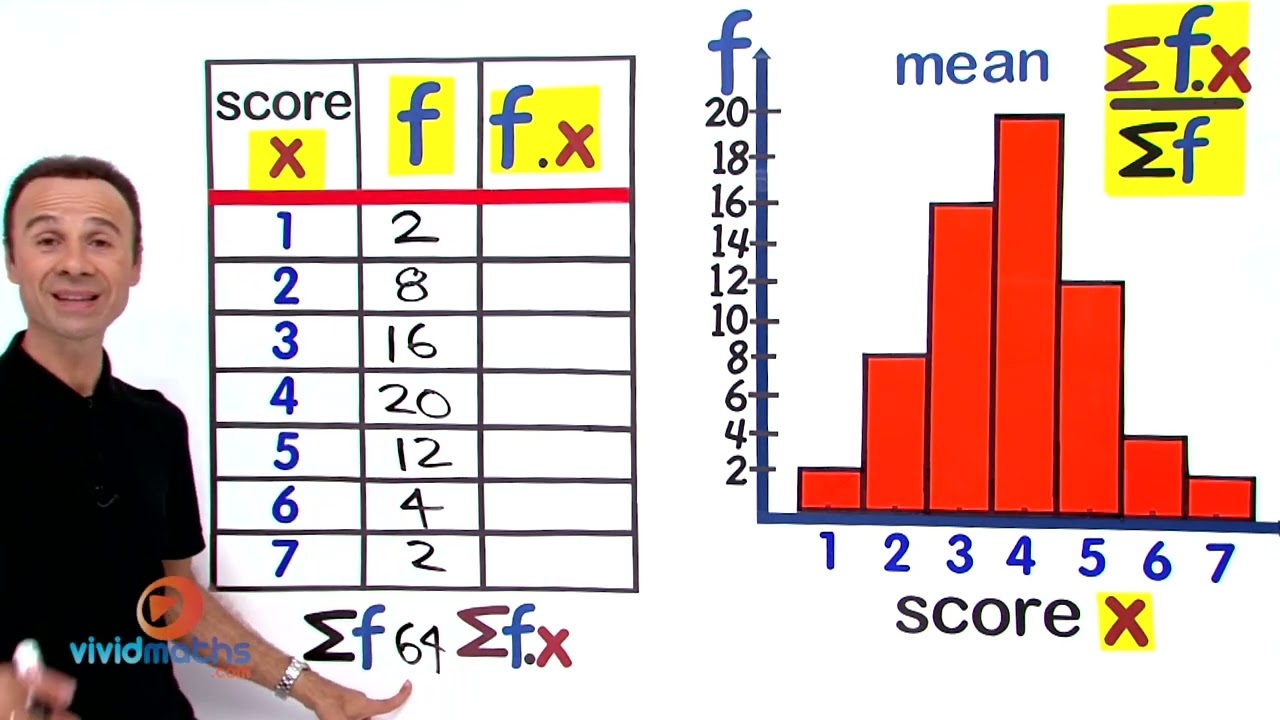
Find the Mean from a Histogram #1
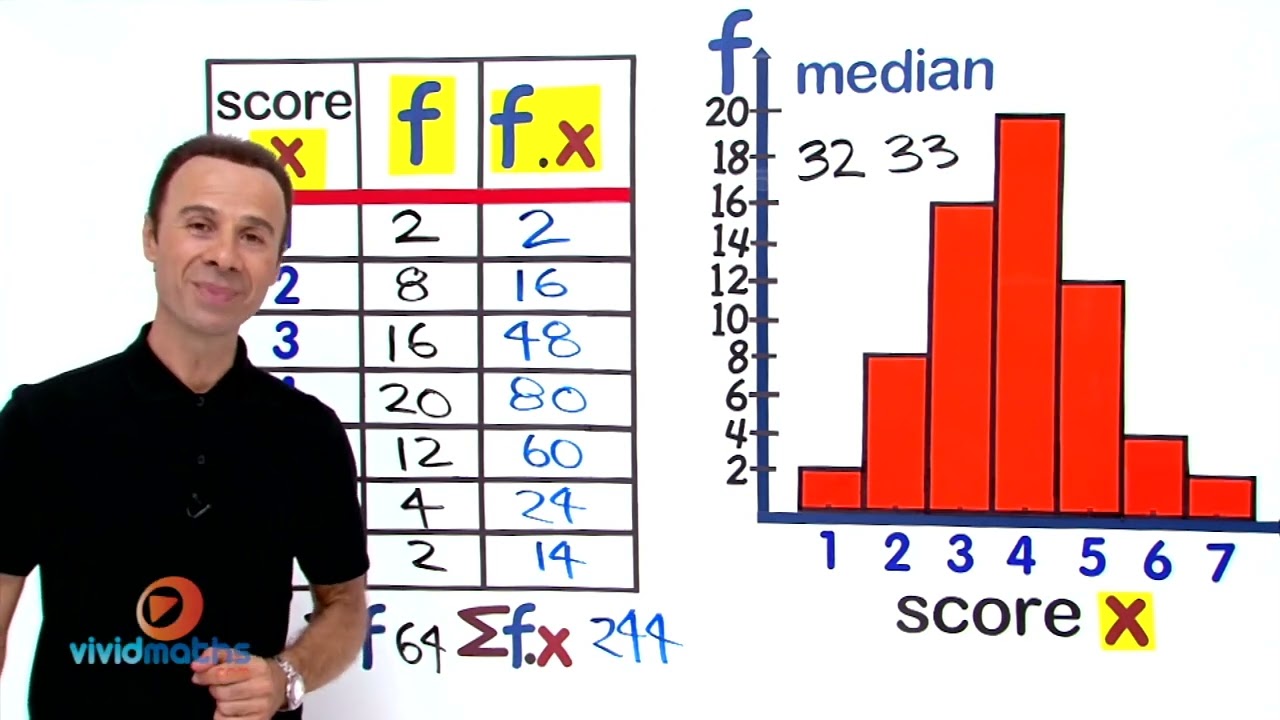
Find the Median from a Histogram #1
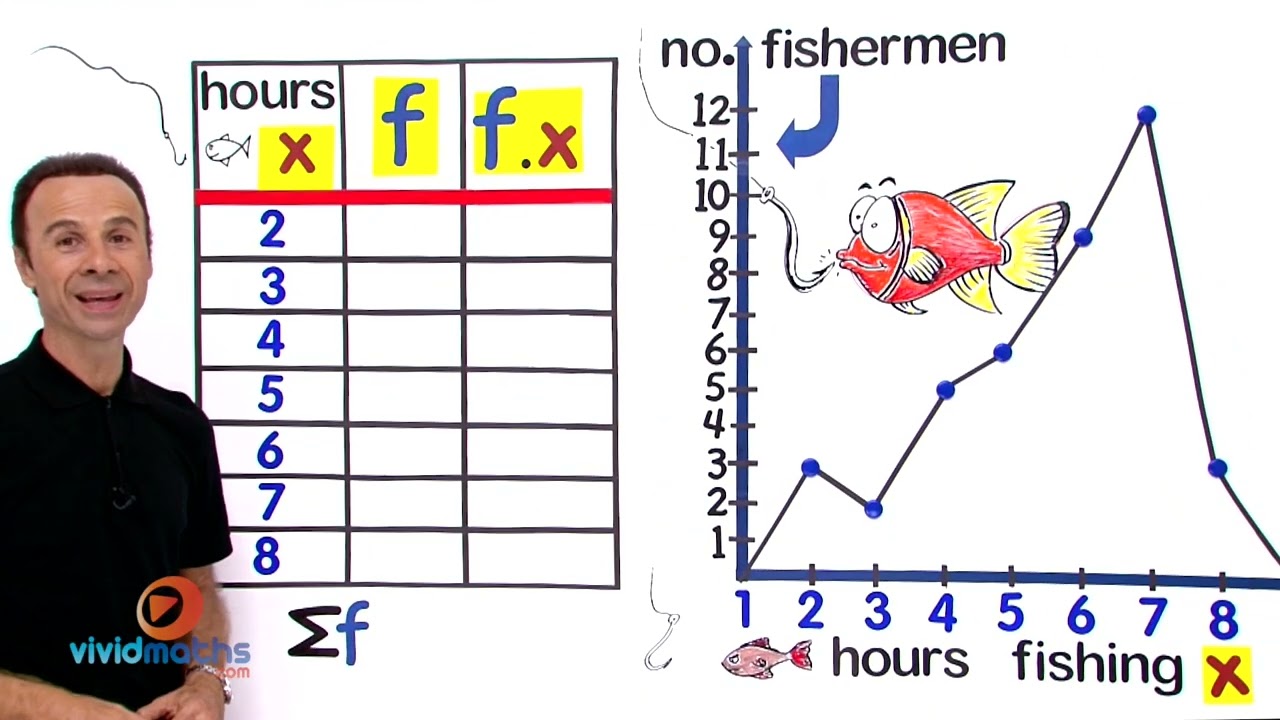
Create a Frequency Table from a Frequency Polygon #1
Find the Mean from a Polygon #1