Menu
Home
Topics
My Insights
About
Contact
Login
Get Started
Topics
My Insights
Login
Get Started
Years
>
Year 12
>
Scatter Plots (Bivariate Data)
Scatter Plots (Bivariate Data)
Jump To
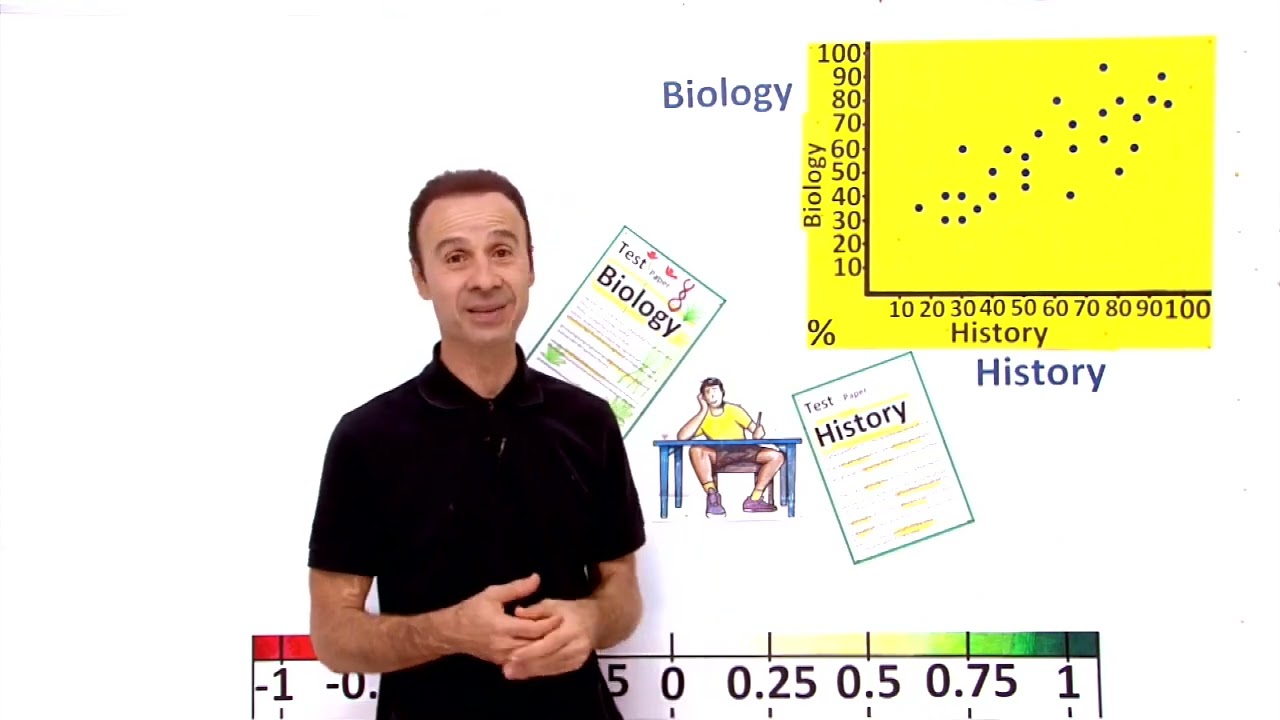
Correlation
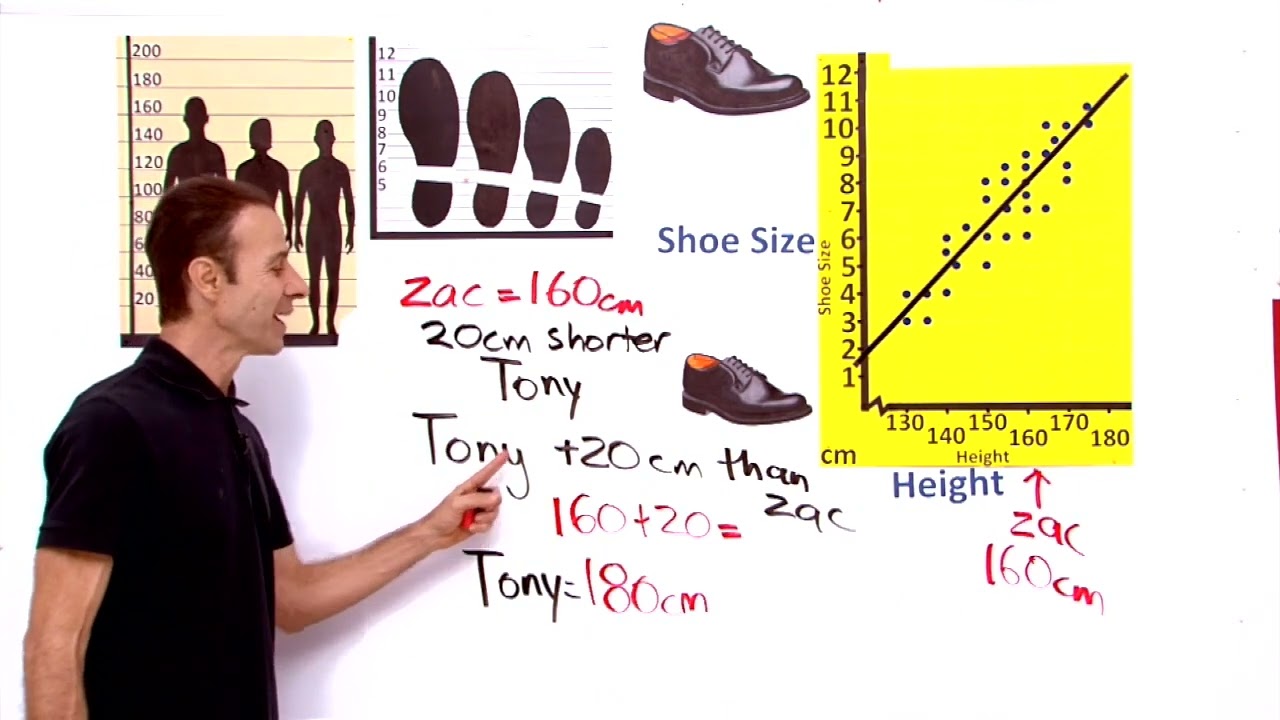
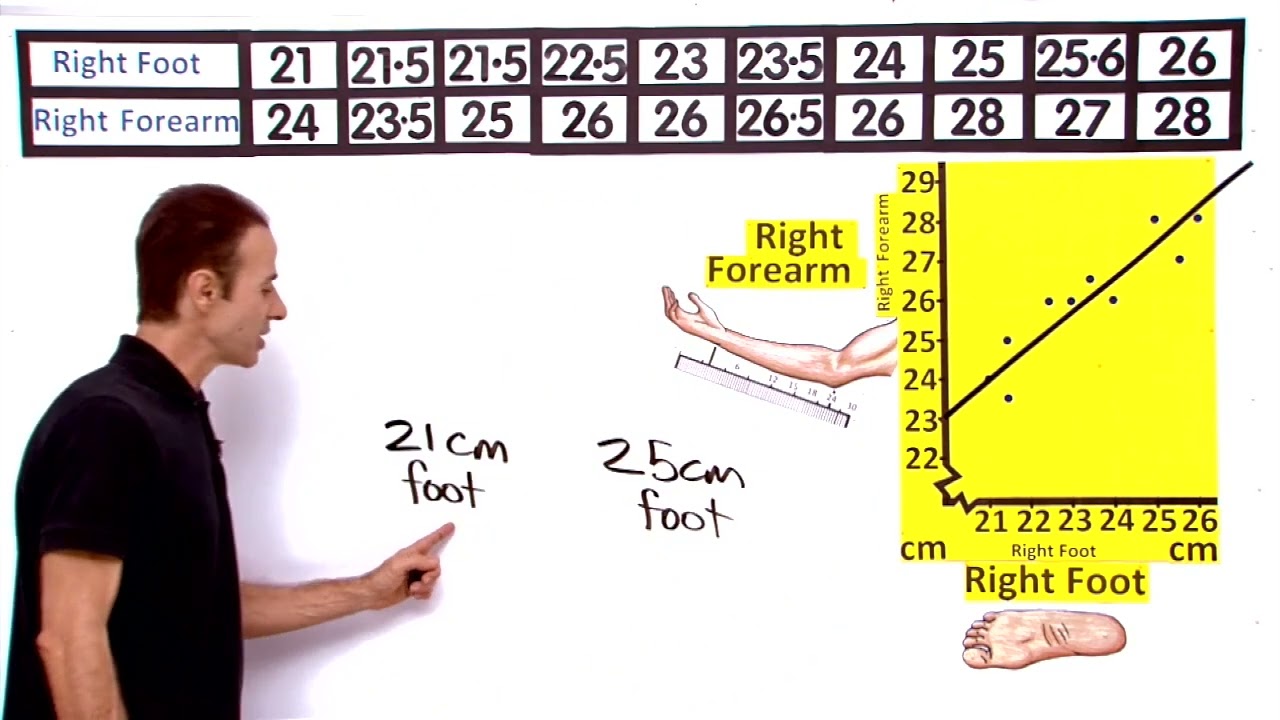
Line of Best Fit
Least Squares Line of Best Fit
Median Regression Line
Try
VividMath Premium
to unlock full access
Start Free Trial
Correlation
Video Quiz 1
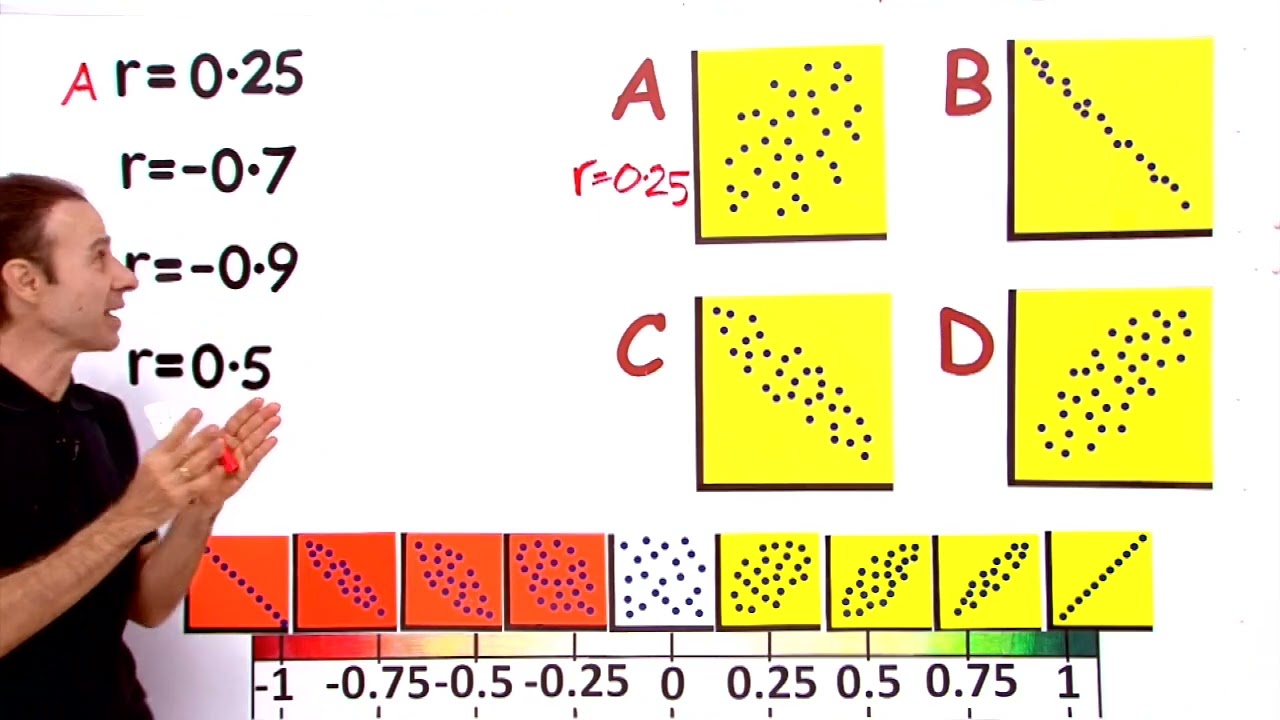
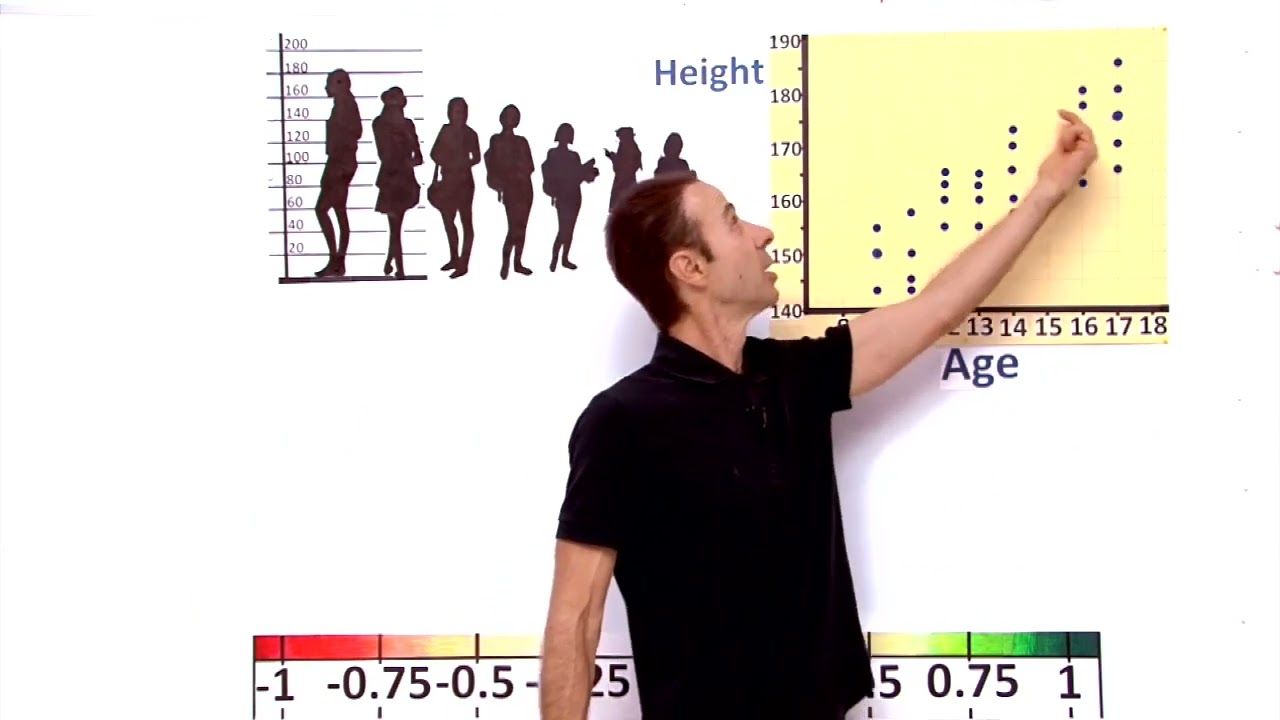
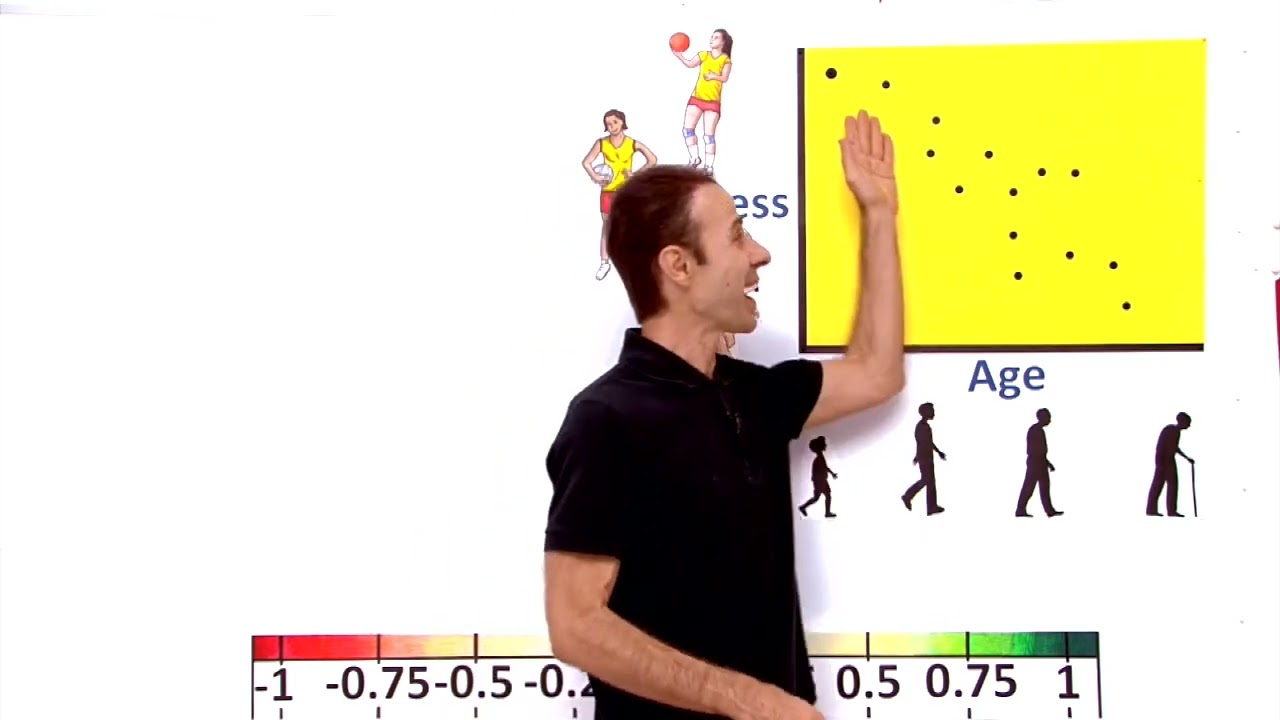
Intro to Correlation – Direction #1
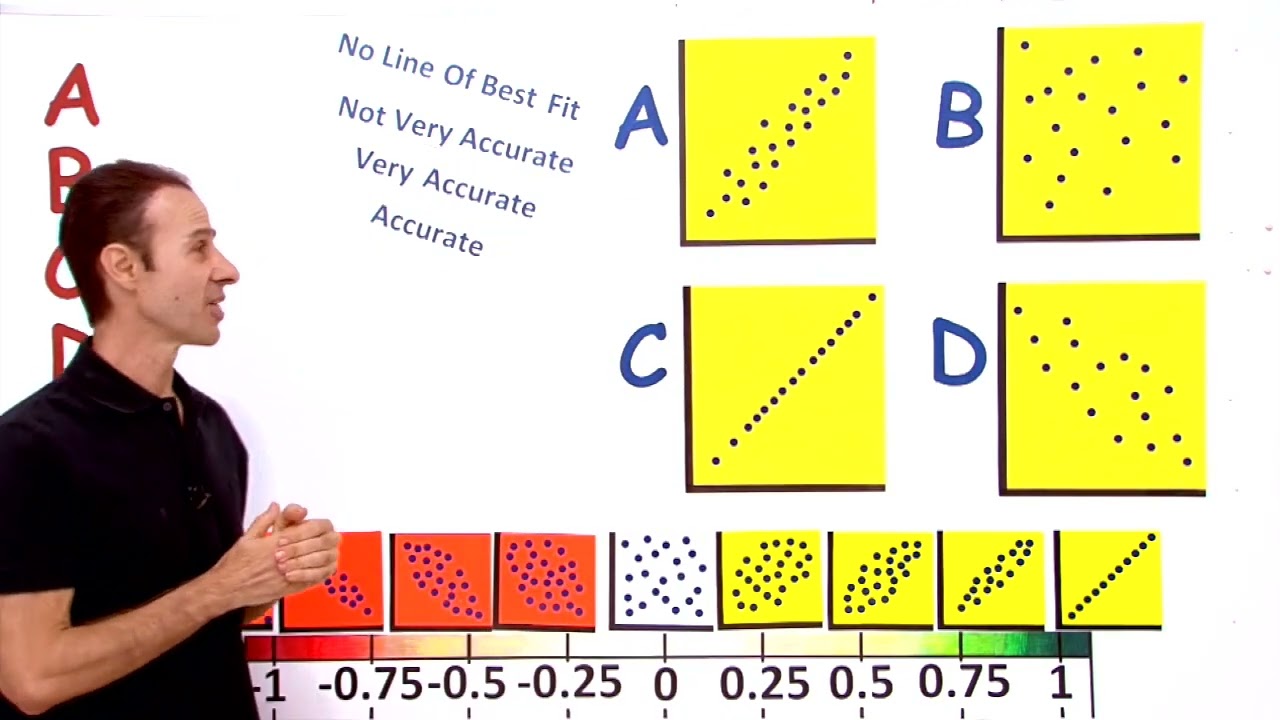
Intro to Correlation – Accuracy #2
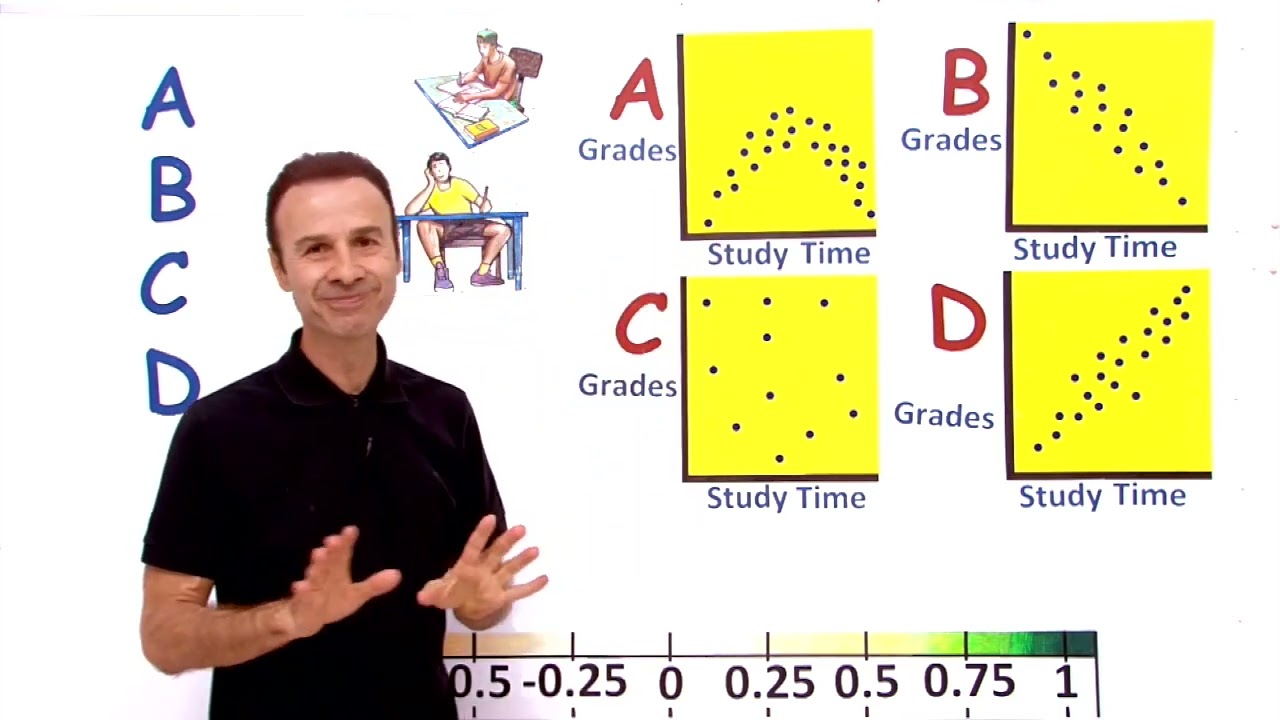
Identify a Scatter Plot #1
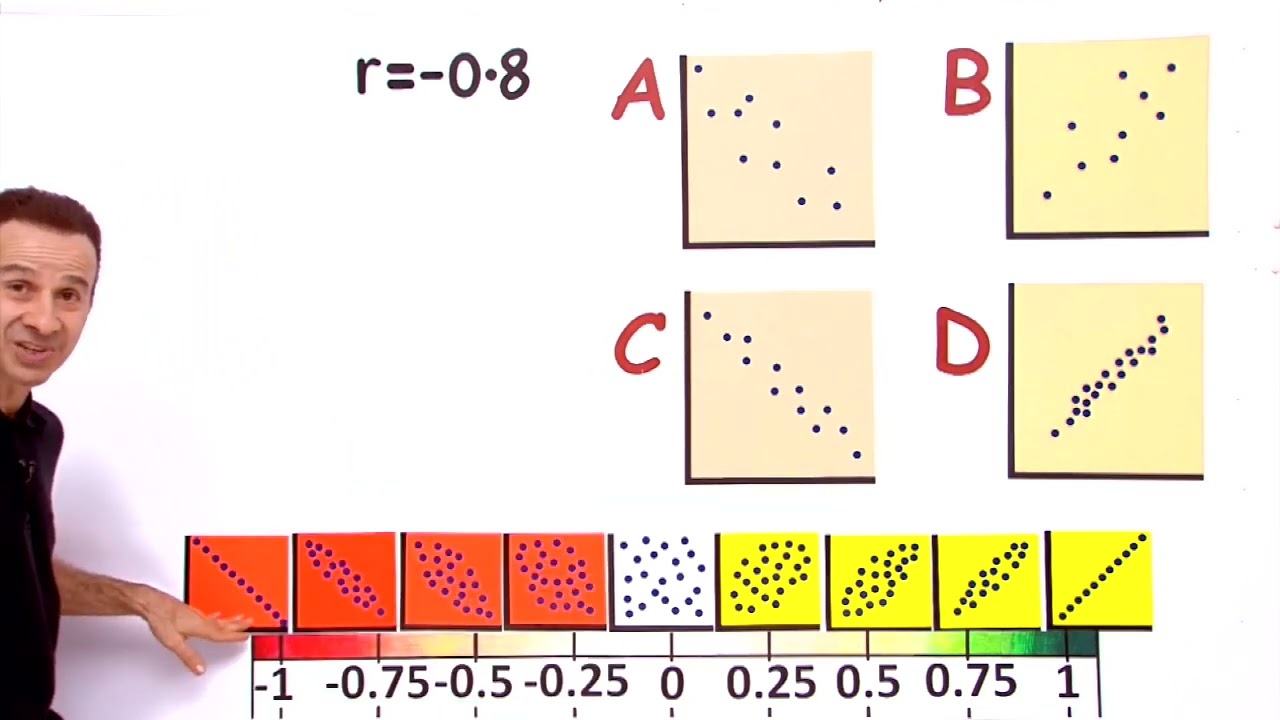
Identify a Scatter Plot #2
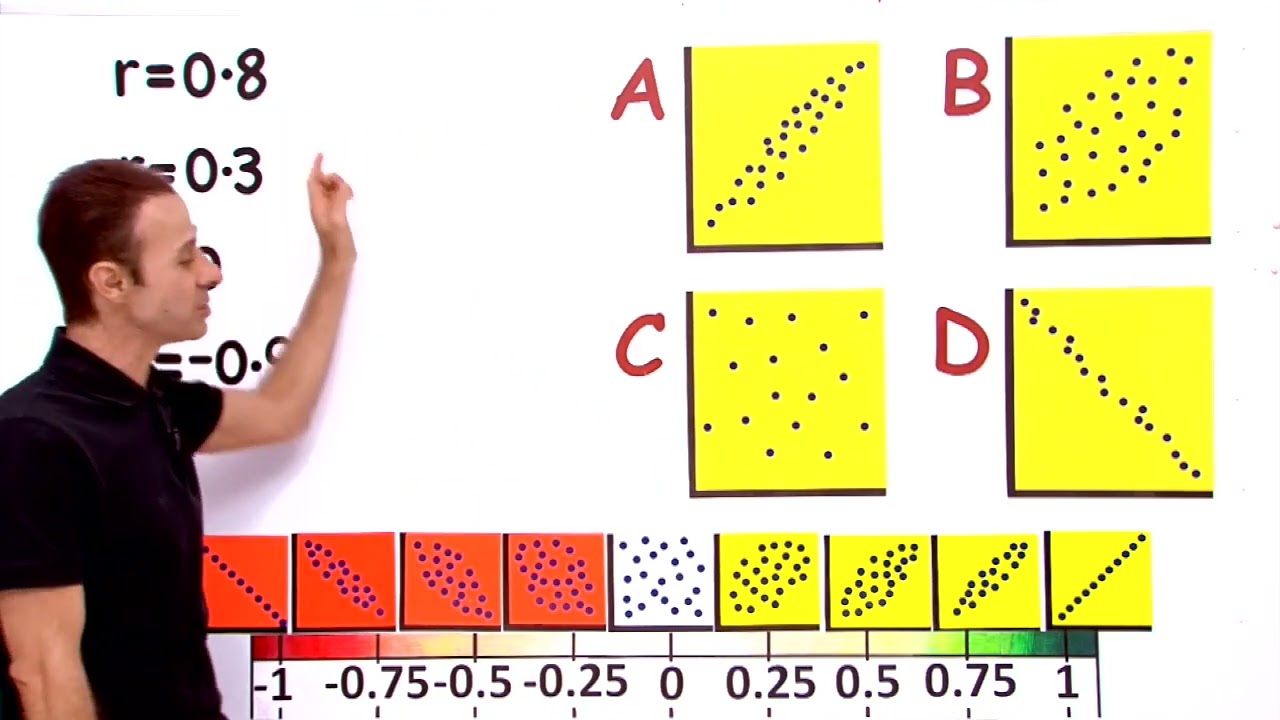
Identify a Scatter Plot #3
Identify a Scatter Plot #4
Line of Best Fit
Video Quiz 1
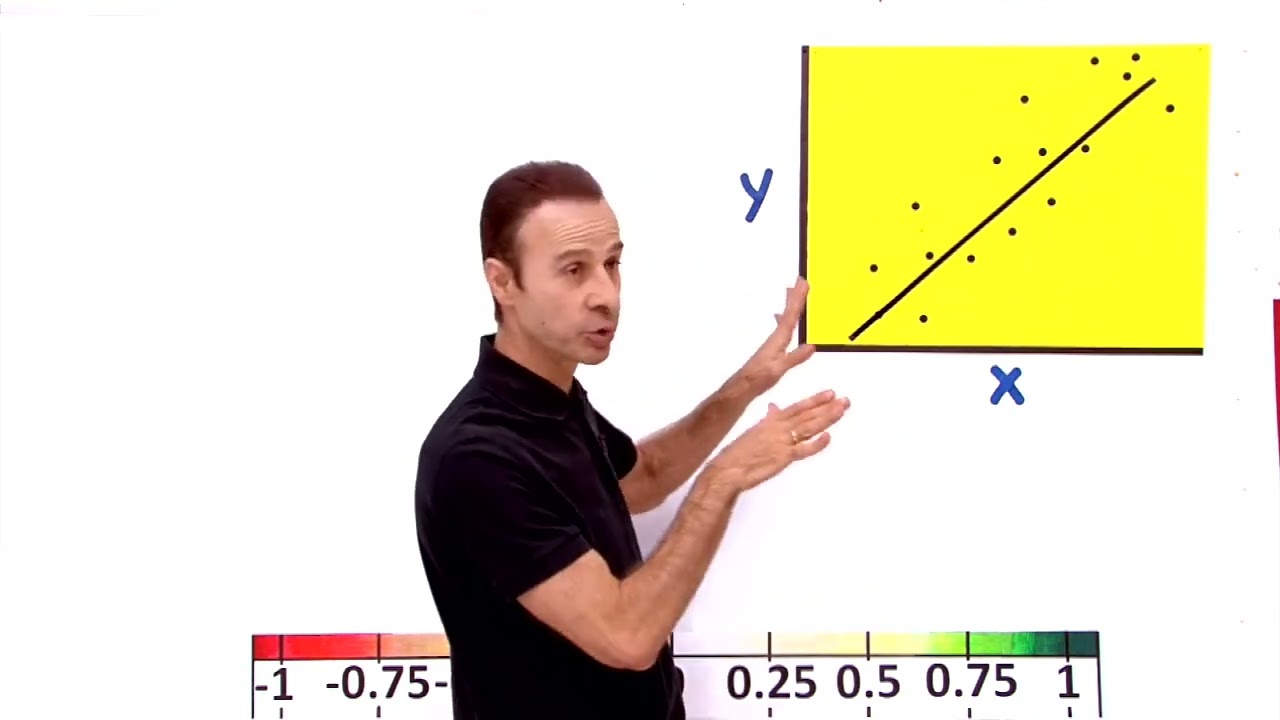
Draw a Line of Best Fit #1
Draw a Line of Best Fit #2
Draw a Line of Best Fit #3
Draw a Line of Best Fit #4
Use the Line of Best Fit to Make a Prediction #1
Use the Line of Best Fit to Make a Prediction #2
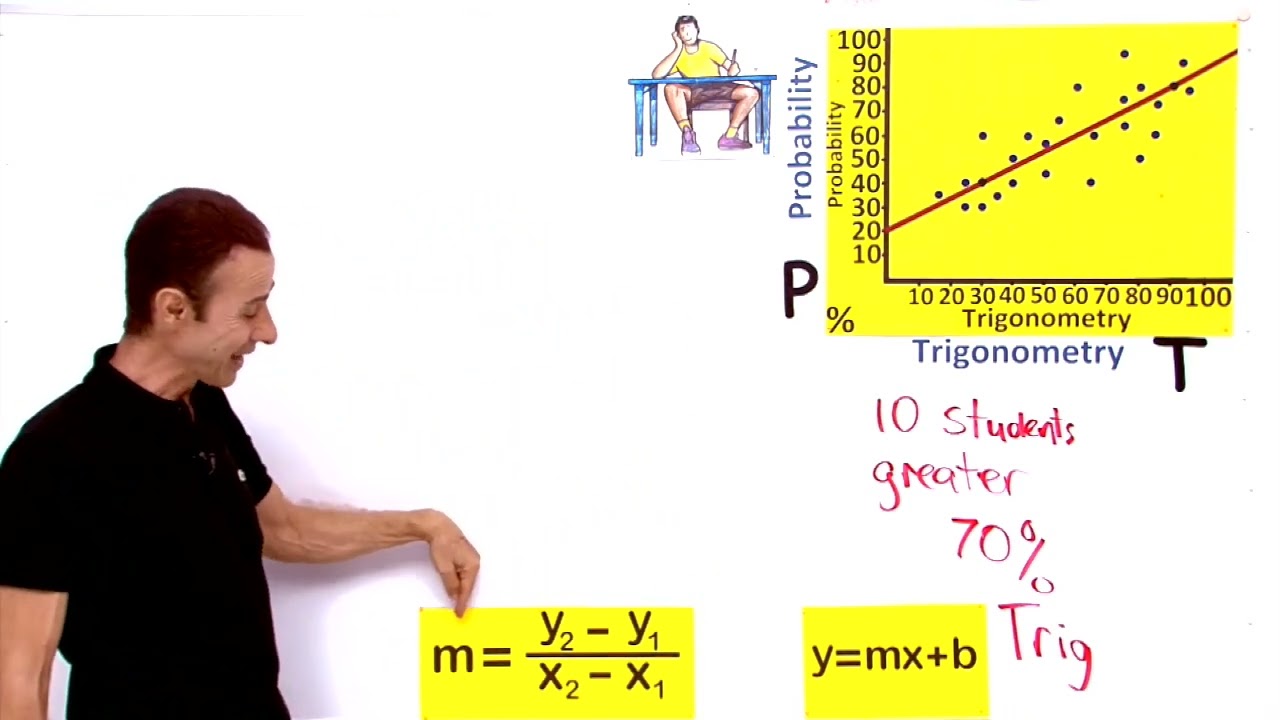
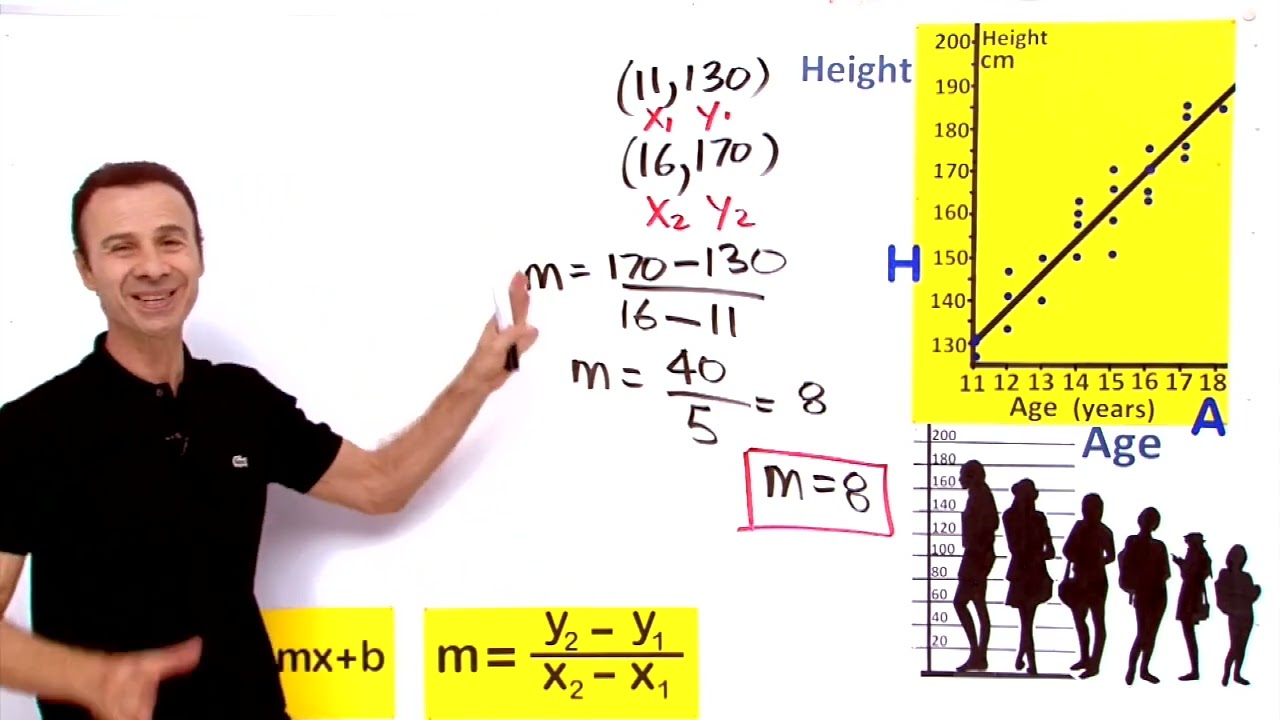
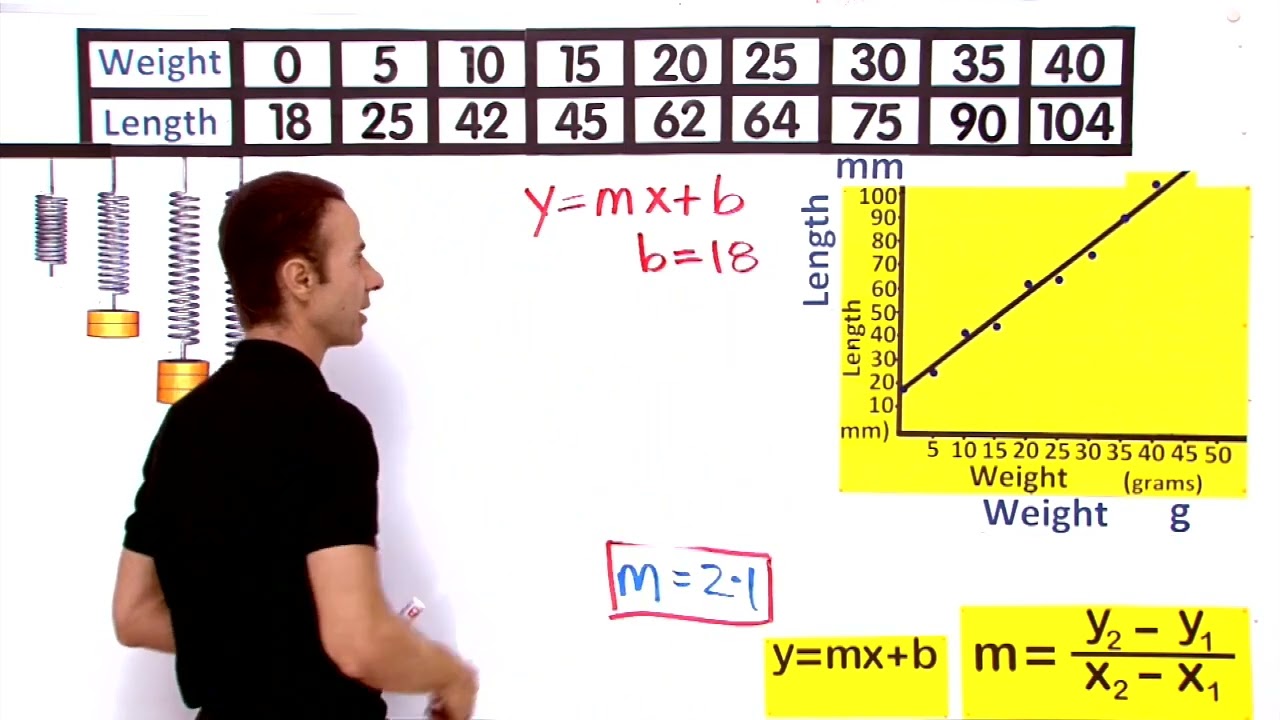
Line of Best Fit – Positive Correlation – Equation of the Line 01
Line of Best Fit – Positive Correlation – Equation of the Line 02
Line of Best Fit – Positive Correlation – Equation of the Line 03 (Part 1)
Line of Best Fit – Positive Correlation – Equation of the Line 04
Least Squares Line of Best Fit
Video Quiz 1
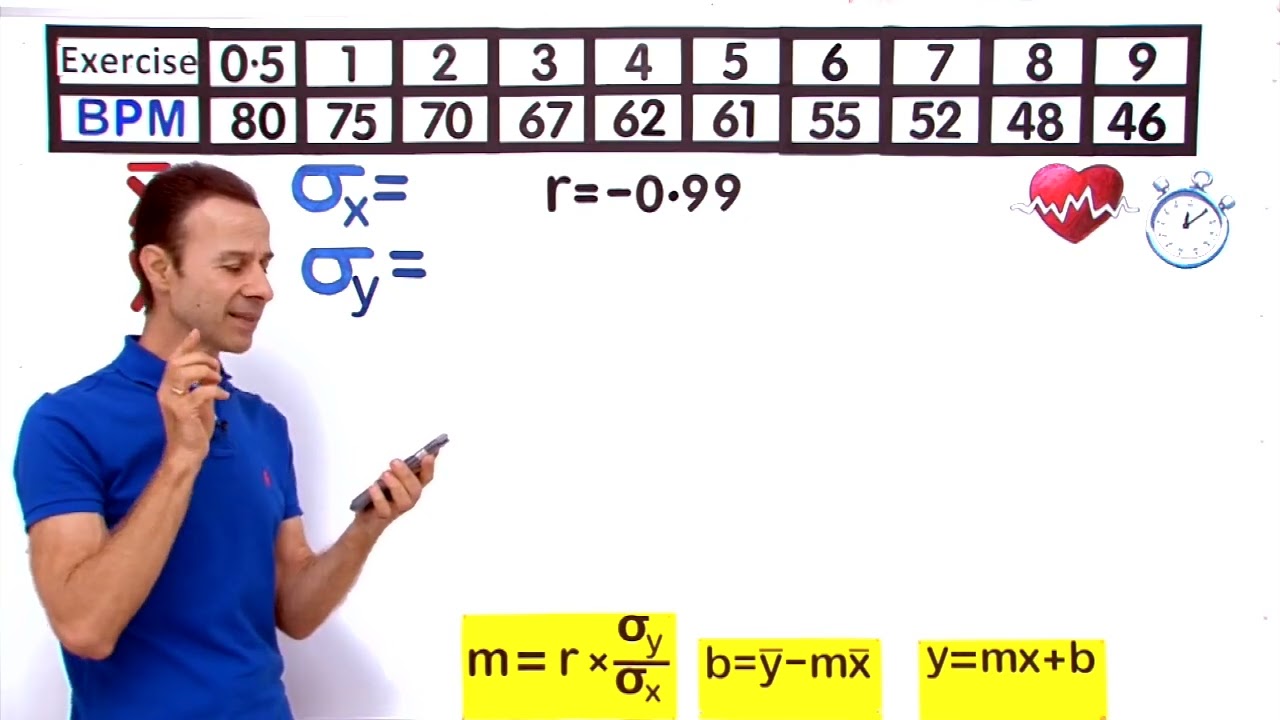
Least Squares Line of Best Fit 01
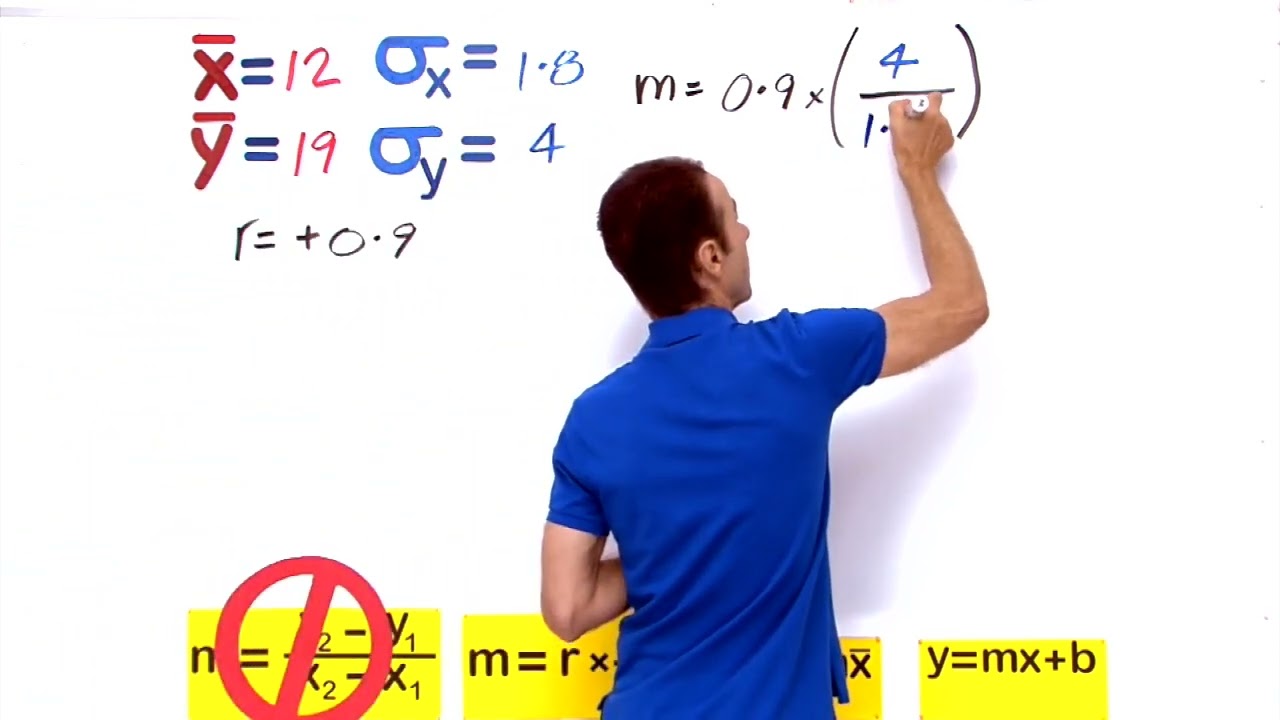
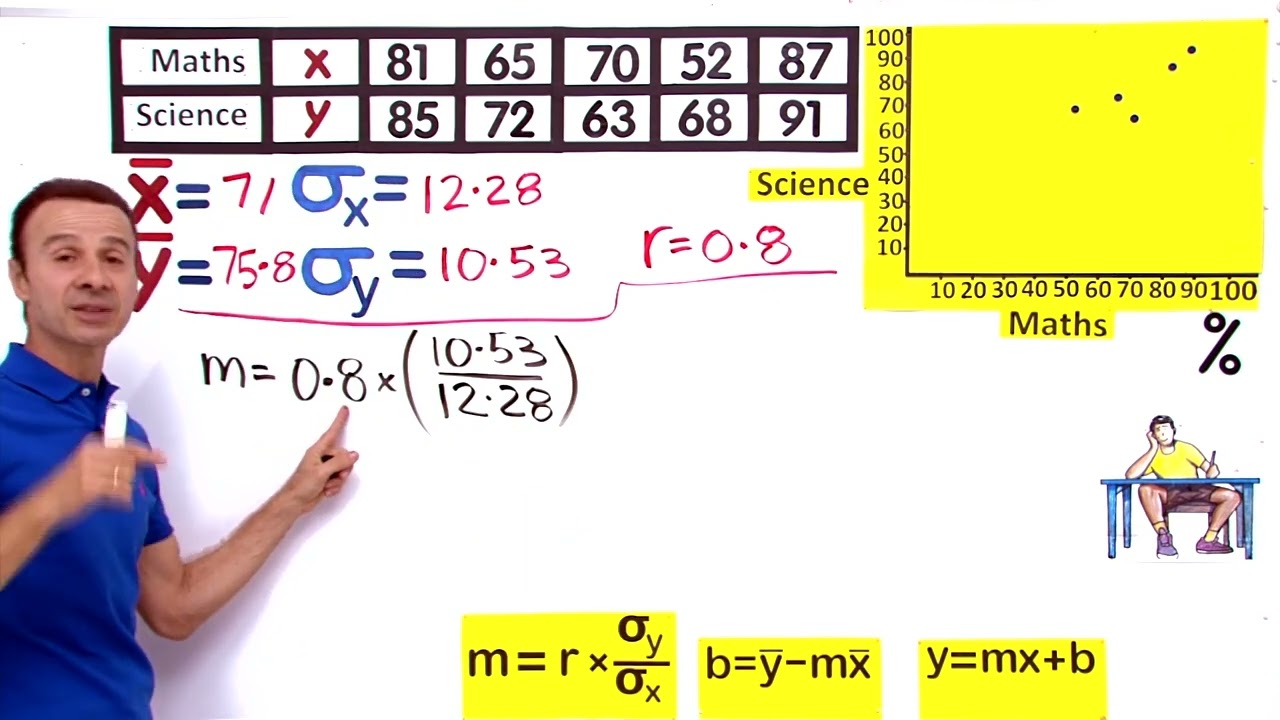
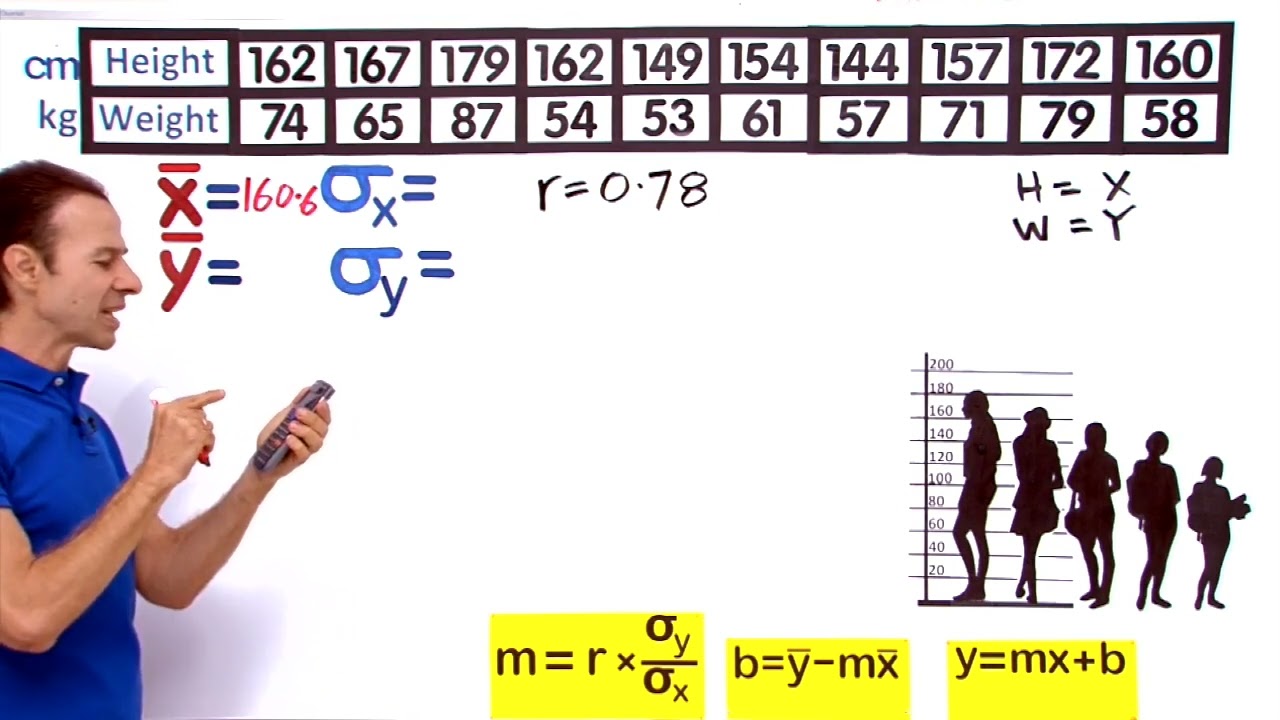
Least Squares Line of Best Fit – Equation of the Line 01
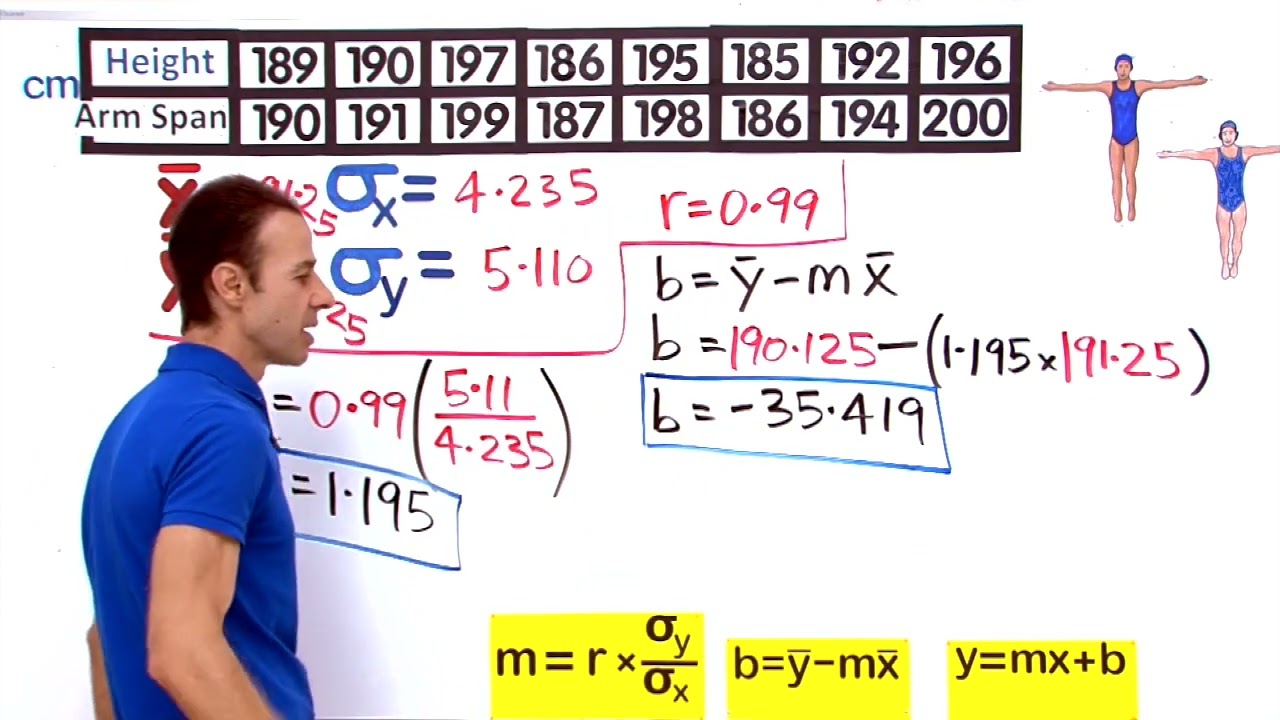
Least Squares Line of Best Fit – Equation of the Line 02
Least Squares Line of Best Fit – Equation of the Line 03
Least Squares Line of Best Fit – Equation of the Line 04
Least Squares Line of Best Fit – Drawing from the Equation 01
Least Squares Line of Best Fit – Drawing from the Equation 02
Least Squares Line of Best Fit – Drawing from the Equation 03
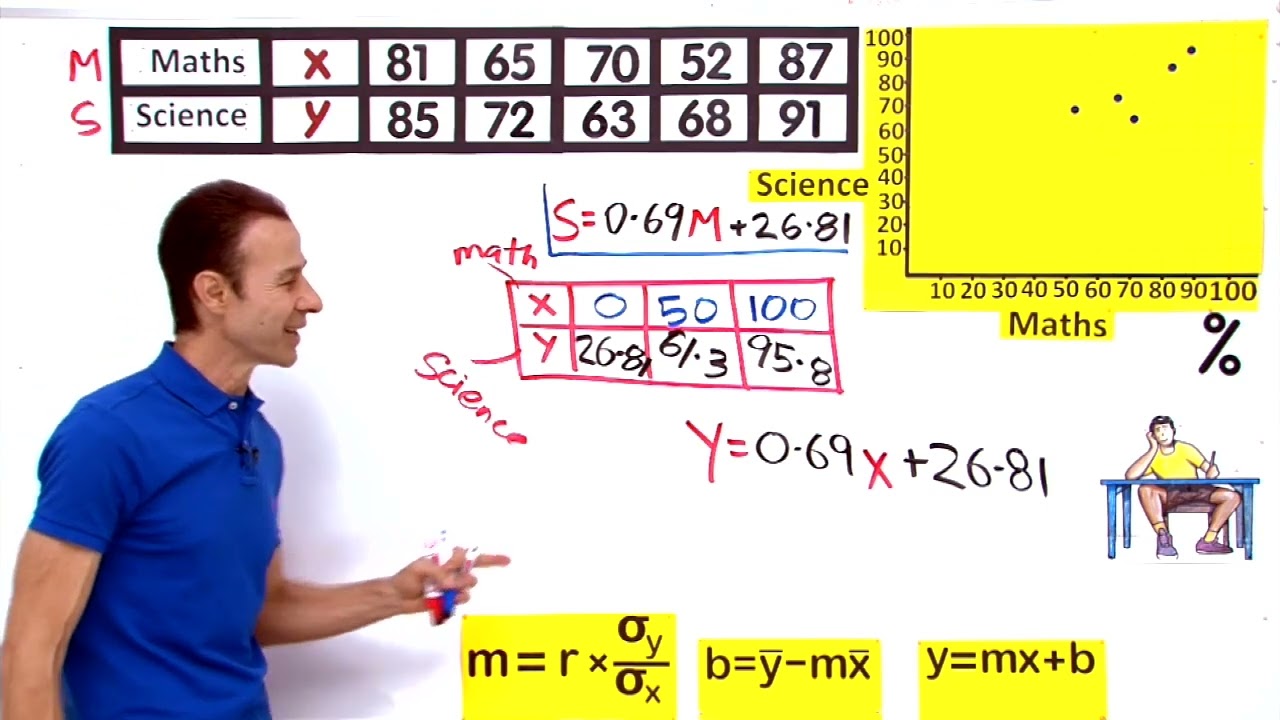
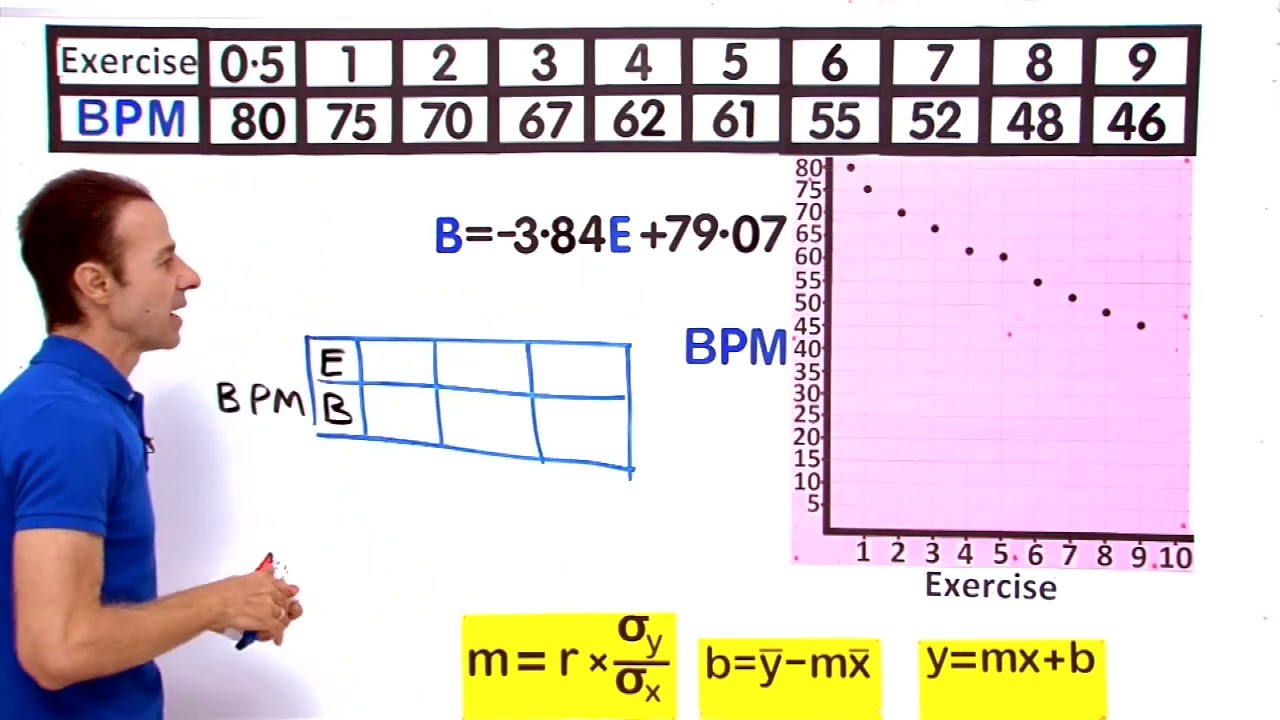
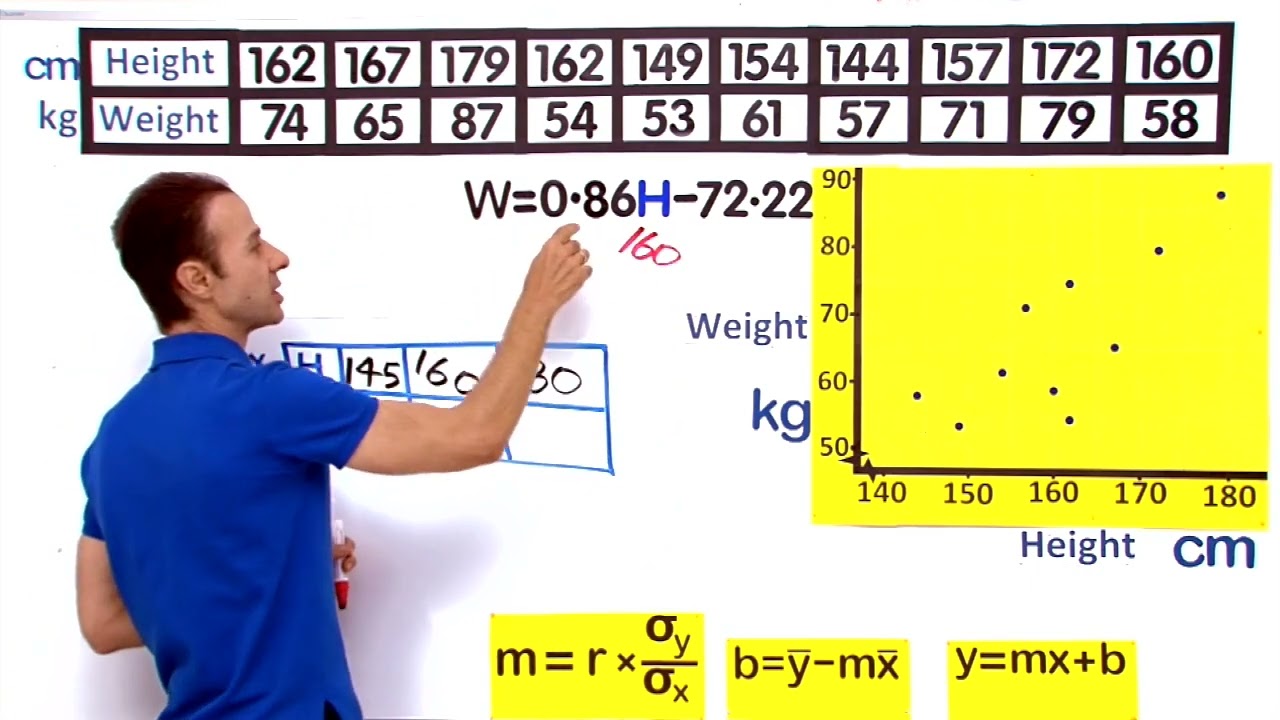
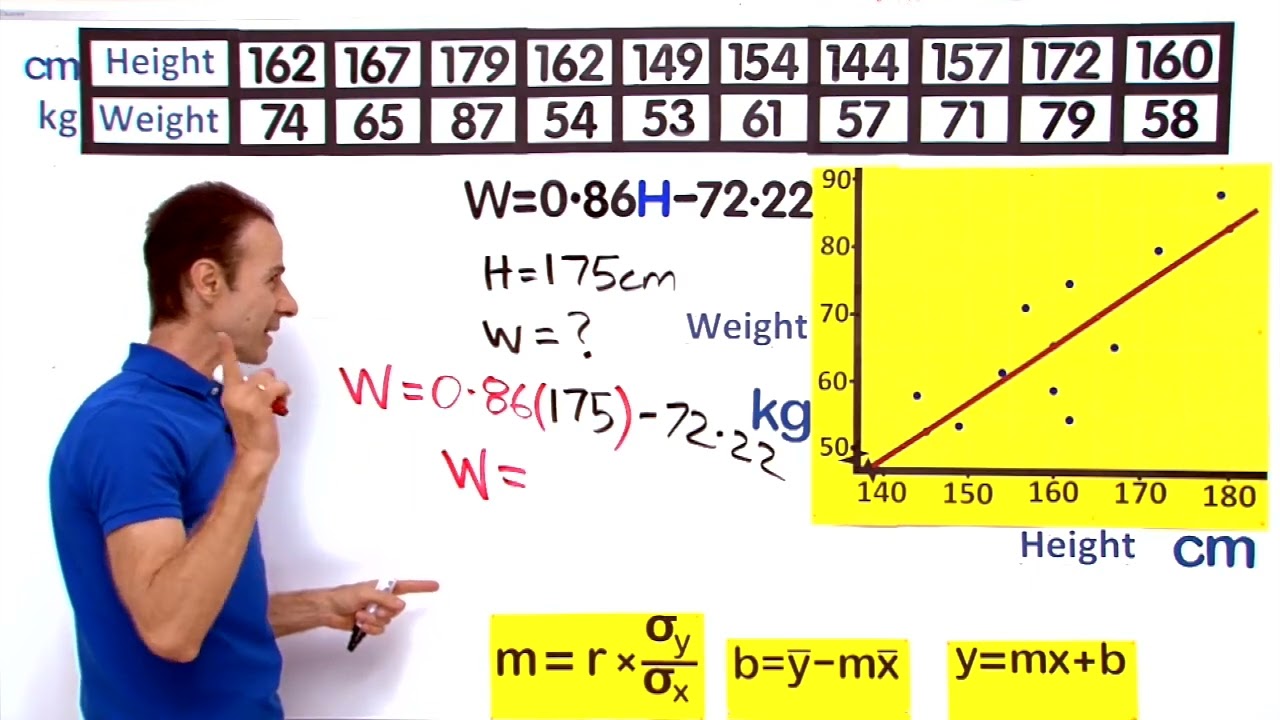
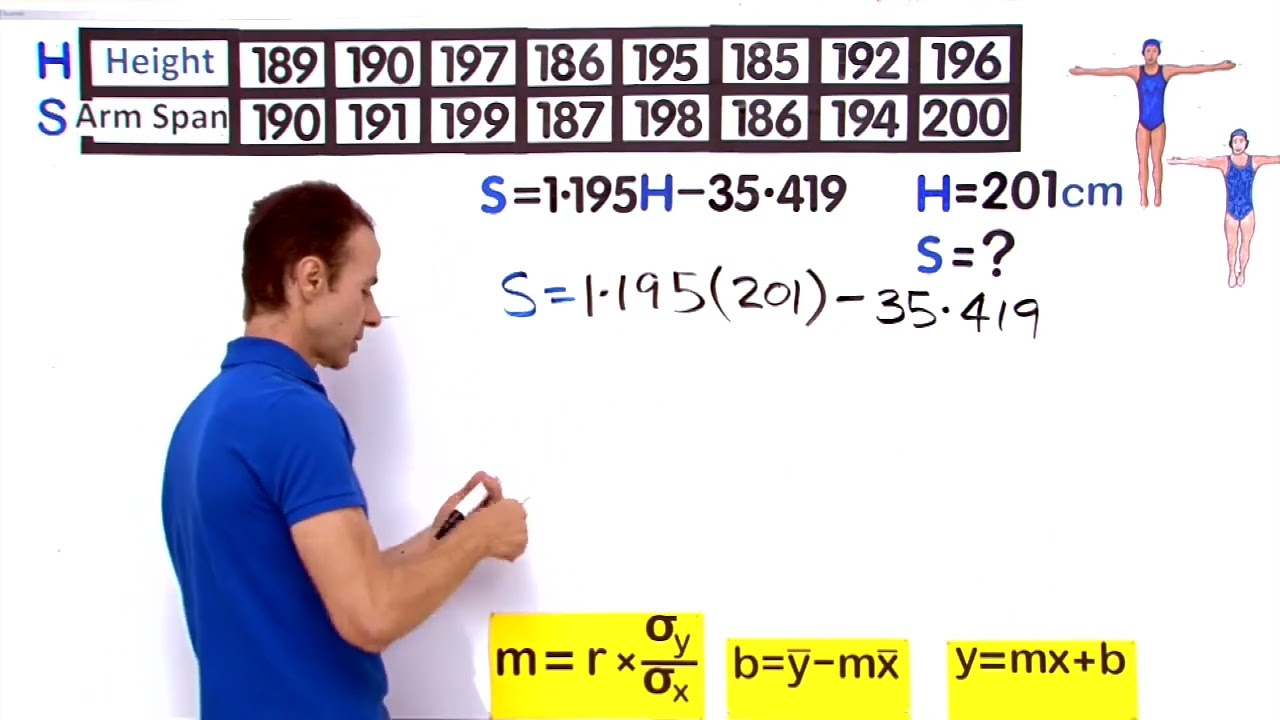
Least Squares Line of Best Fit – Making a Prediction 01
Least Squares Line of Best Fit – Making a Prediction 02
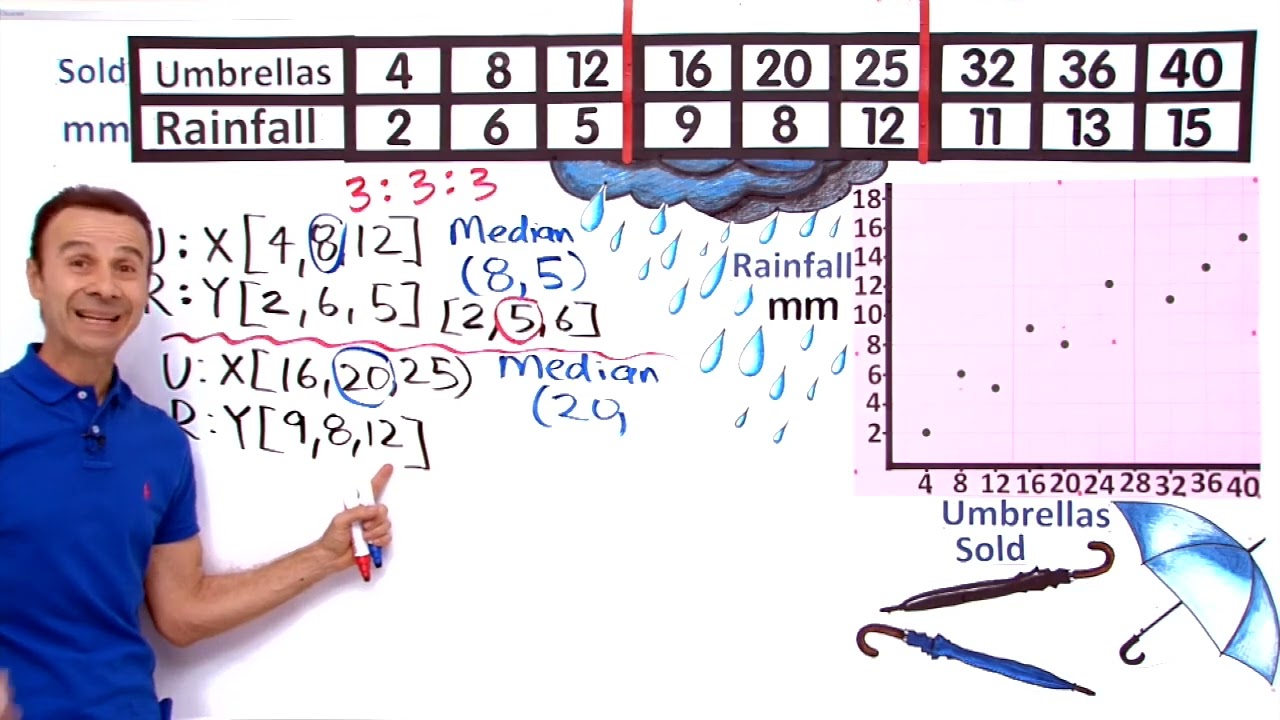
Median Regression Line
Video Quiz 1
Find Median Points from the Table #1
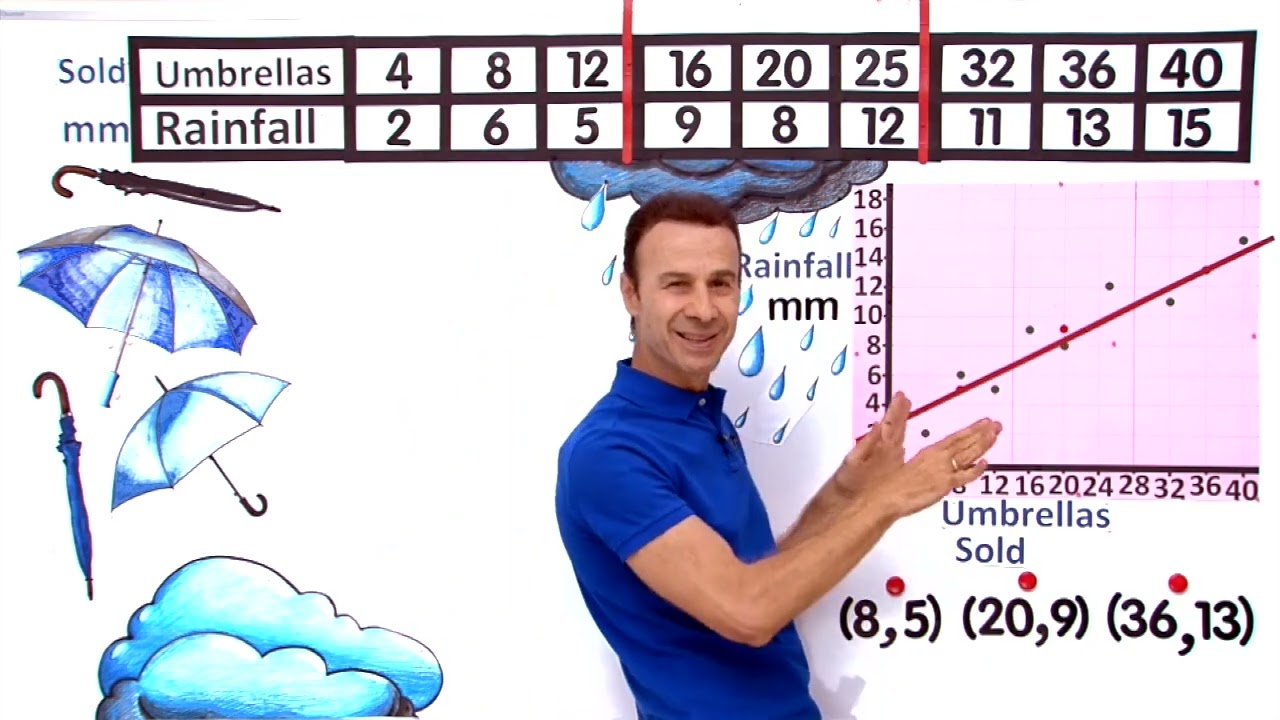
Draw a Median Regression Line #1
Use the Median Regression Line to Make a Prediction #1