Menu
Home
Topics
My Insights
About
Contact
Login
Get Started
Topics
My Insights
Login
Get Started
Years
>
Year 11
>
Statistics and Data
>
Create and Interpret Dot Plots (Line Plots)
Create and Interpret Dot Plots (Line Plots)
Try
VividMath Premium
to unlock full access
Start Free Trial
Create and Interpret Dot Plots (Line Plots)
Video Quiz 1
Video Quiz 2
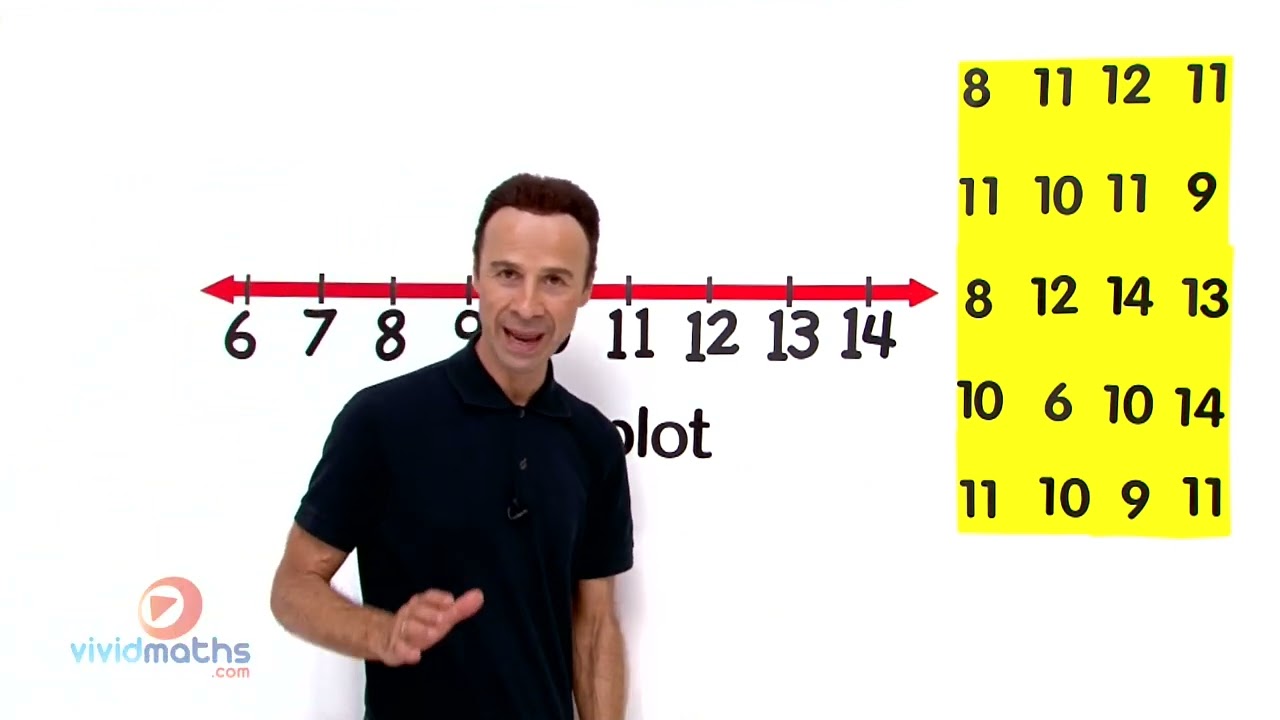
Create a Dot Plot from a Set of Scores #1
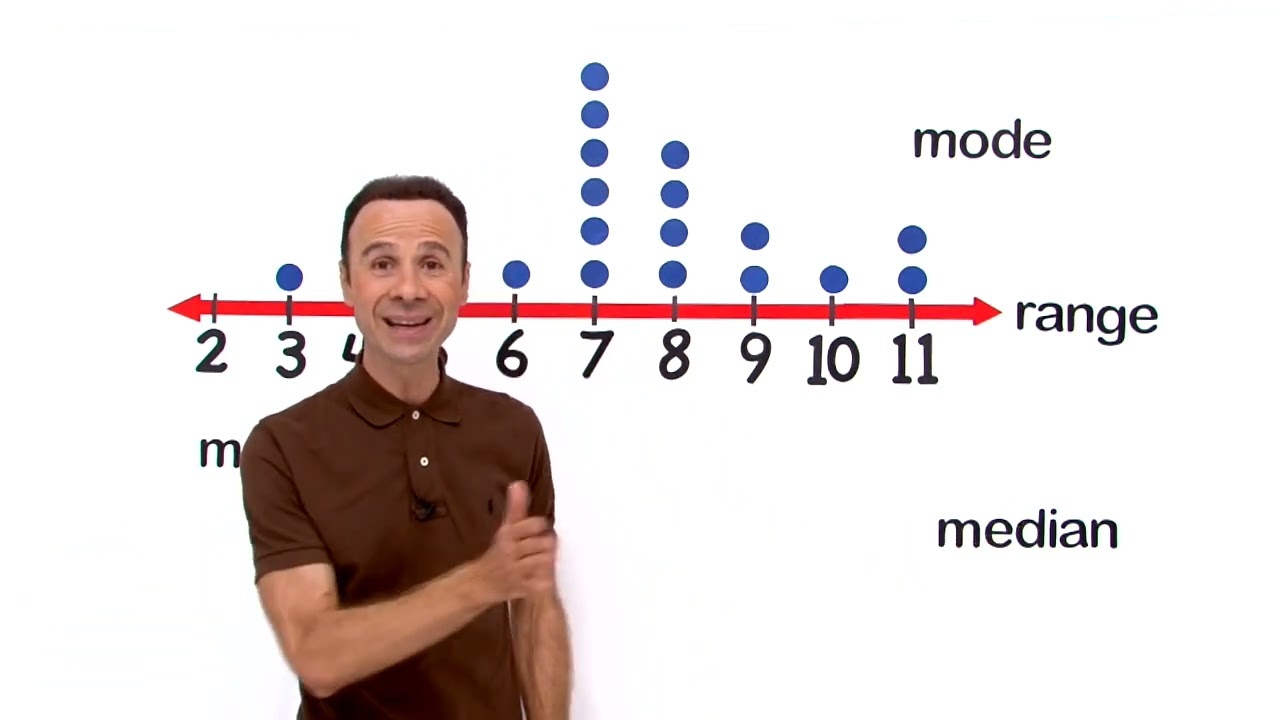
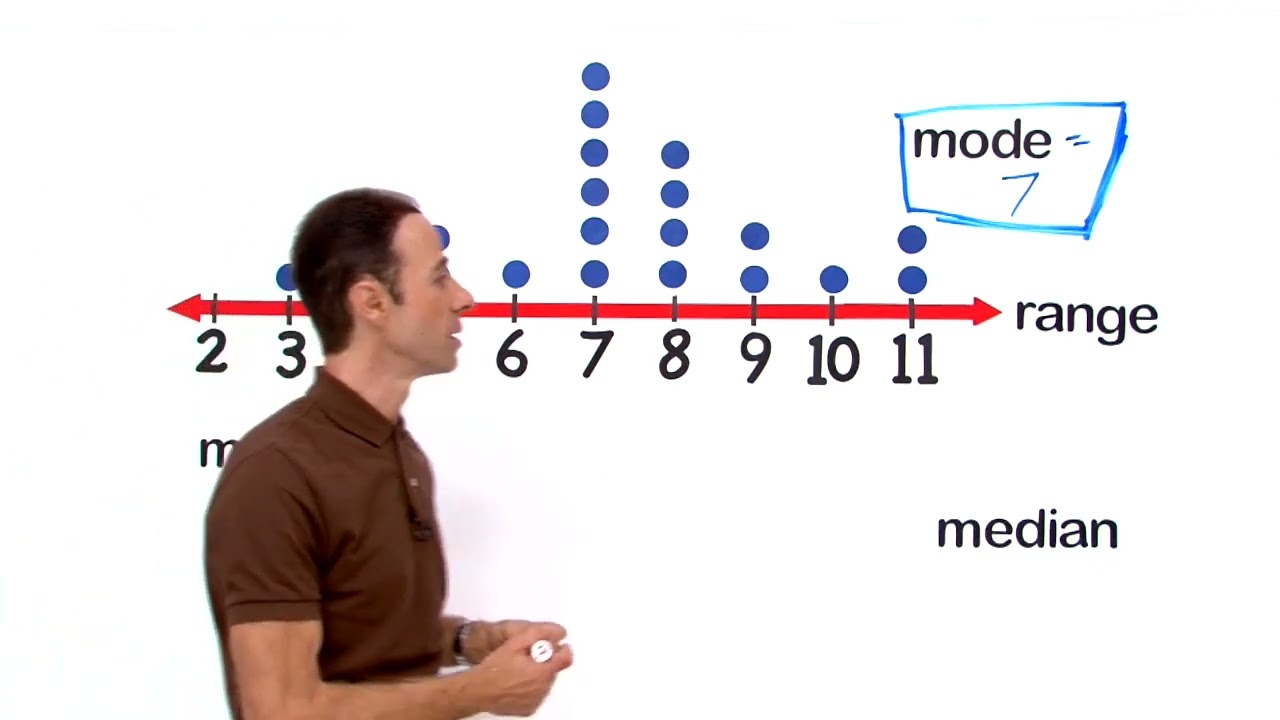
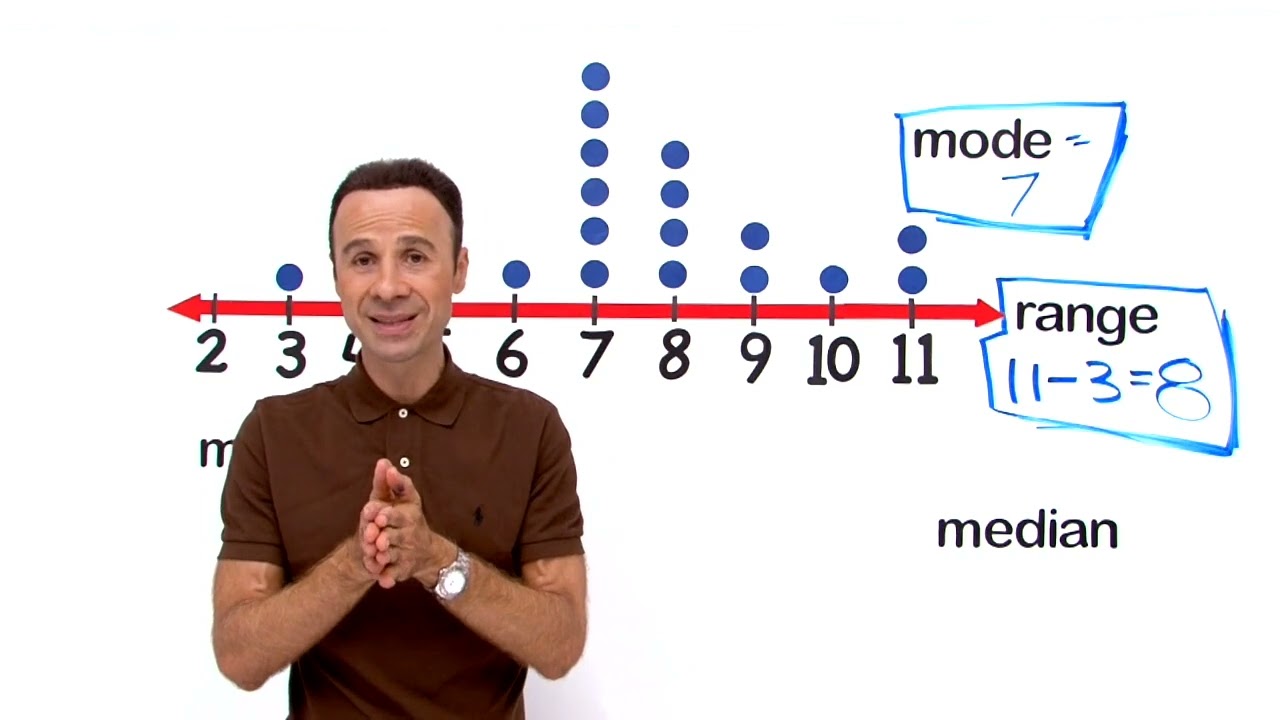
Find the Mode from a Dot Plot #1
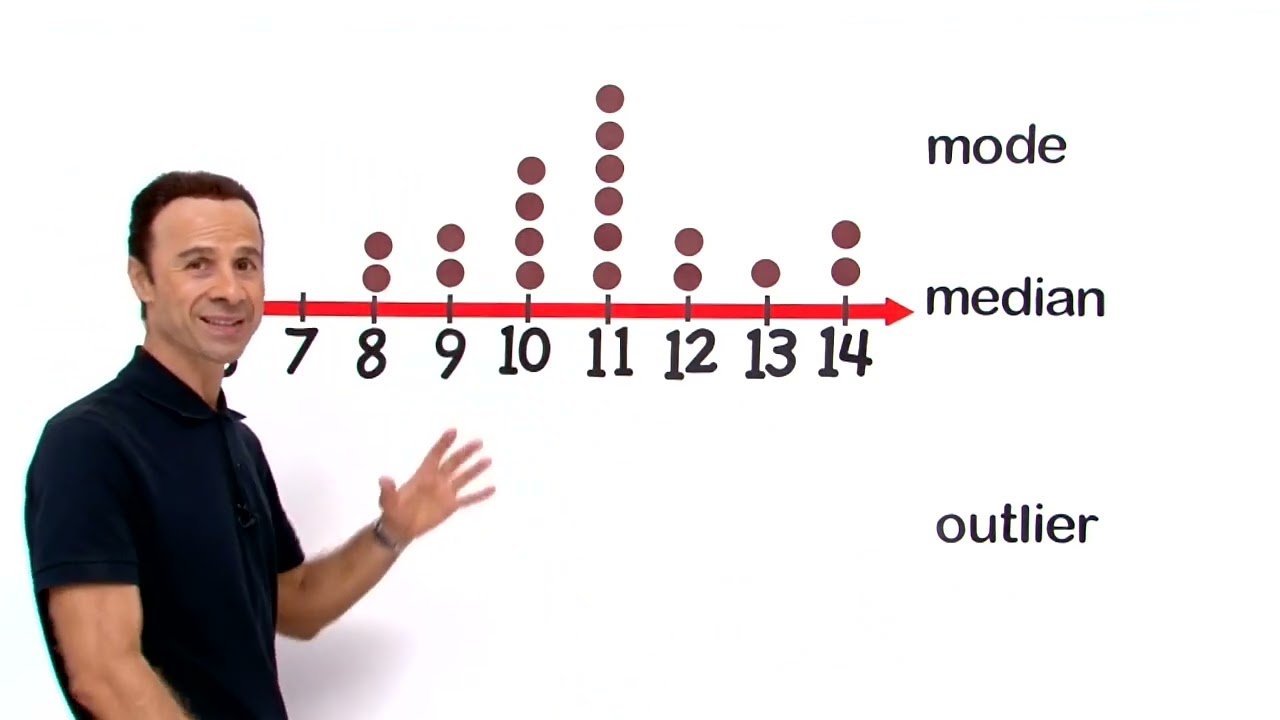
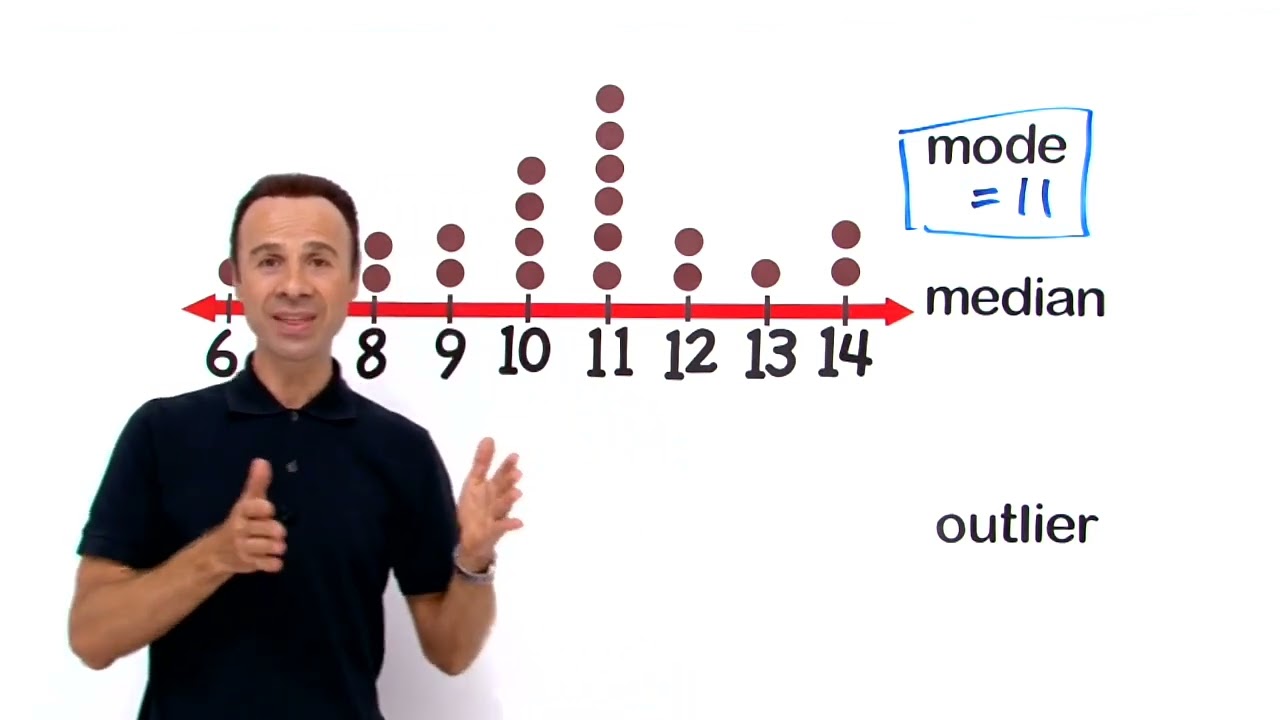
Find the Mode from a Dot Plot #2
Find the Range from a Dot Plot #1
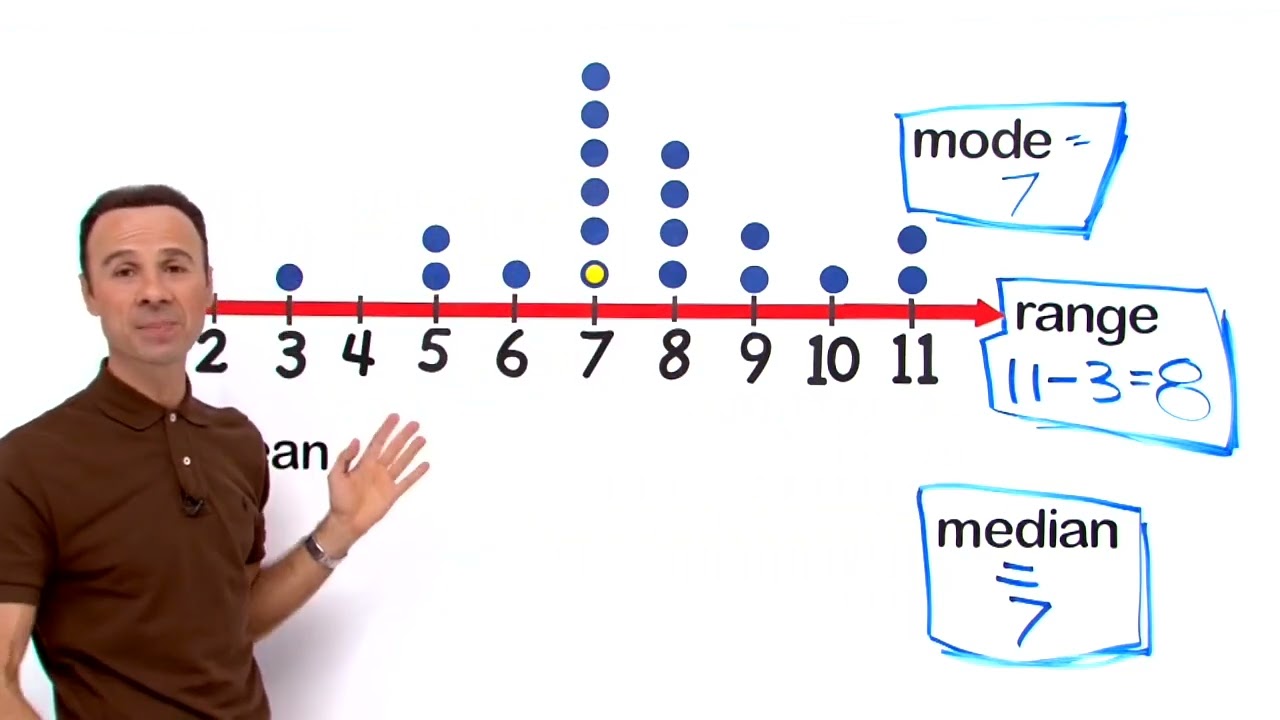
Find the Median from a Dot Plot #1
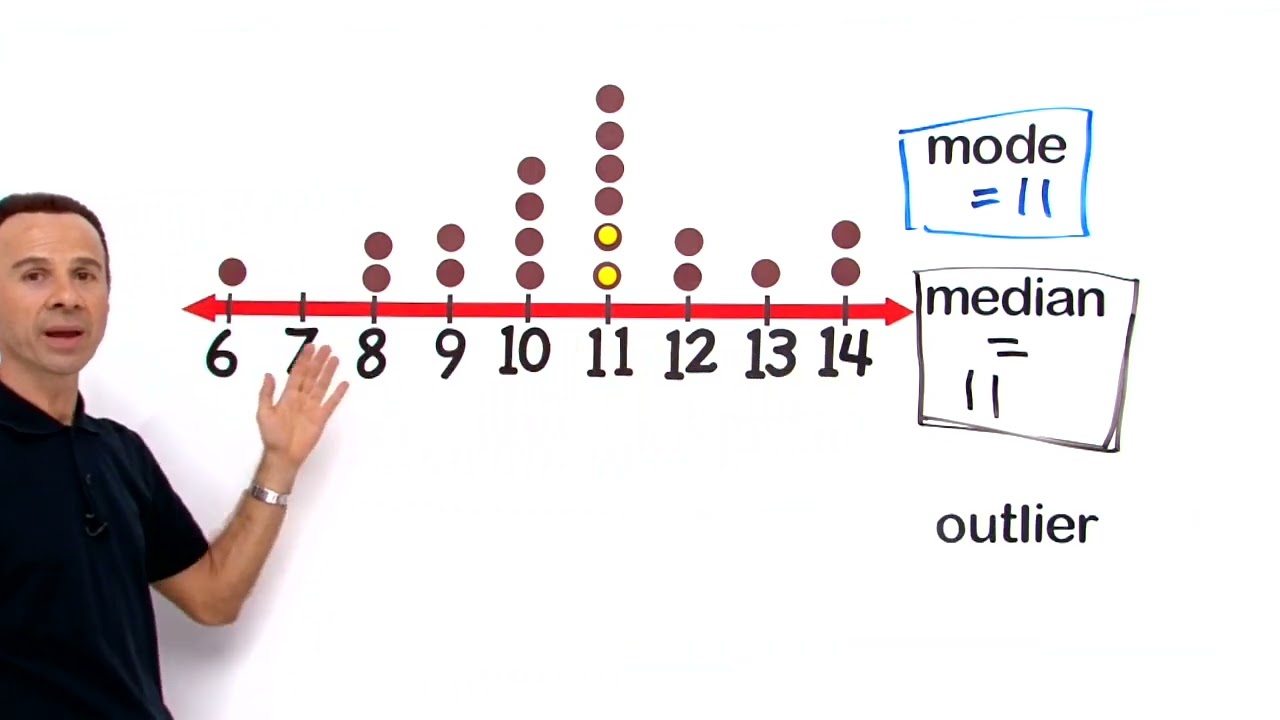
Find the Median from a Dot Plot #2
Find the Mean from a Dot Plot #1
Find the Outlier from a Dot Plot #1