Statistics and Data
Jump To
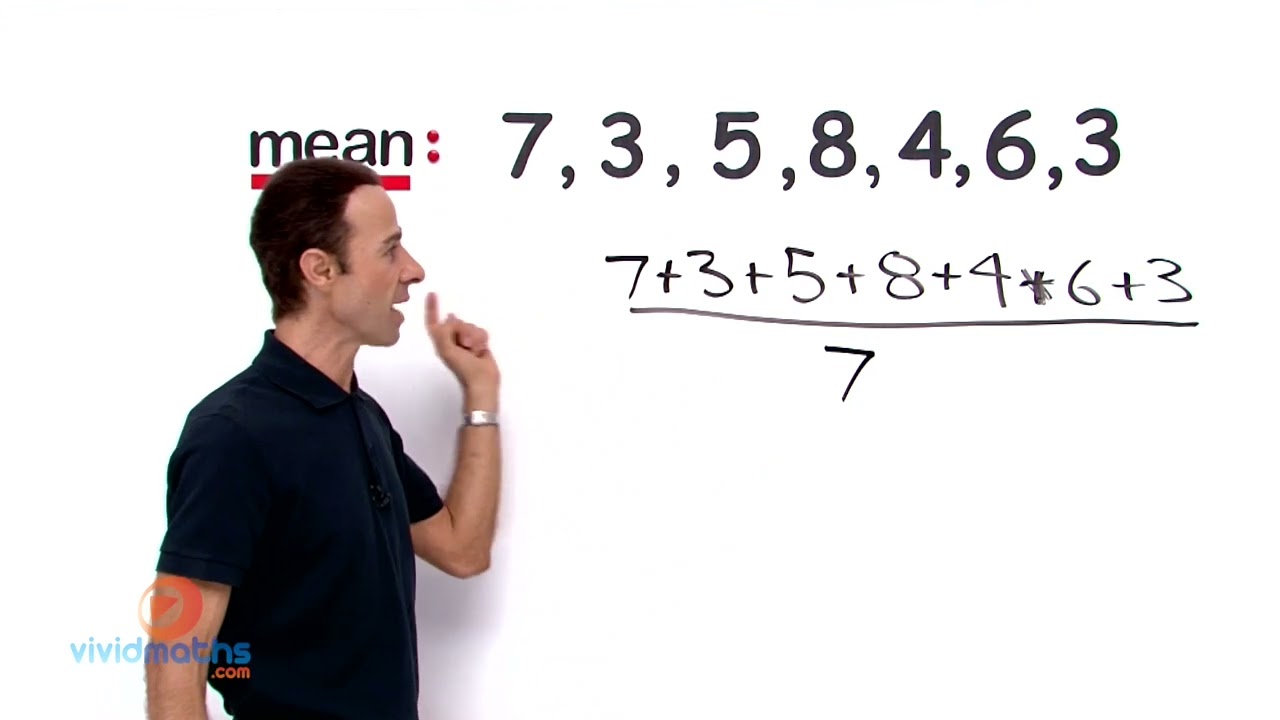
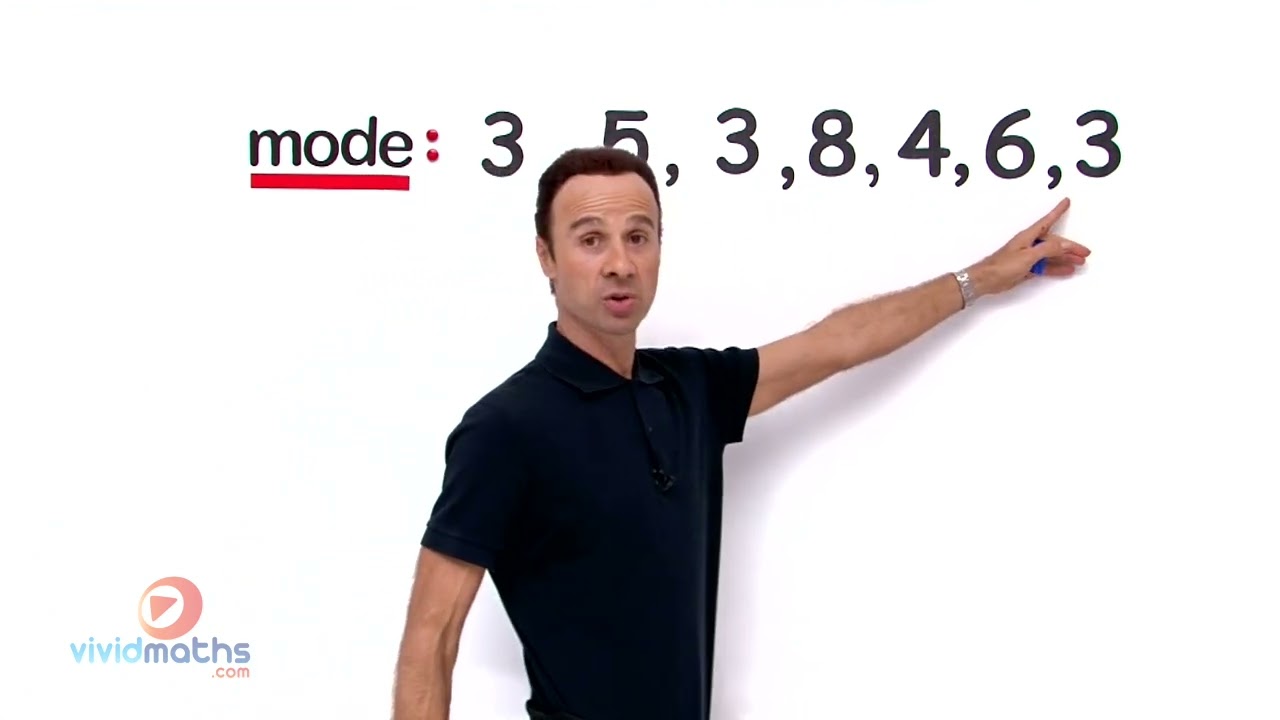
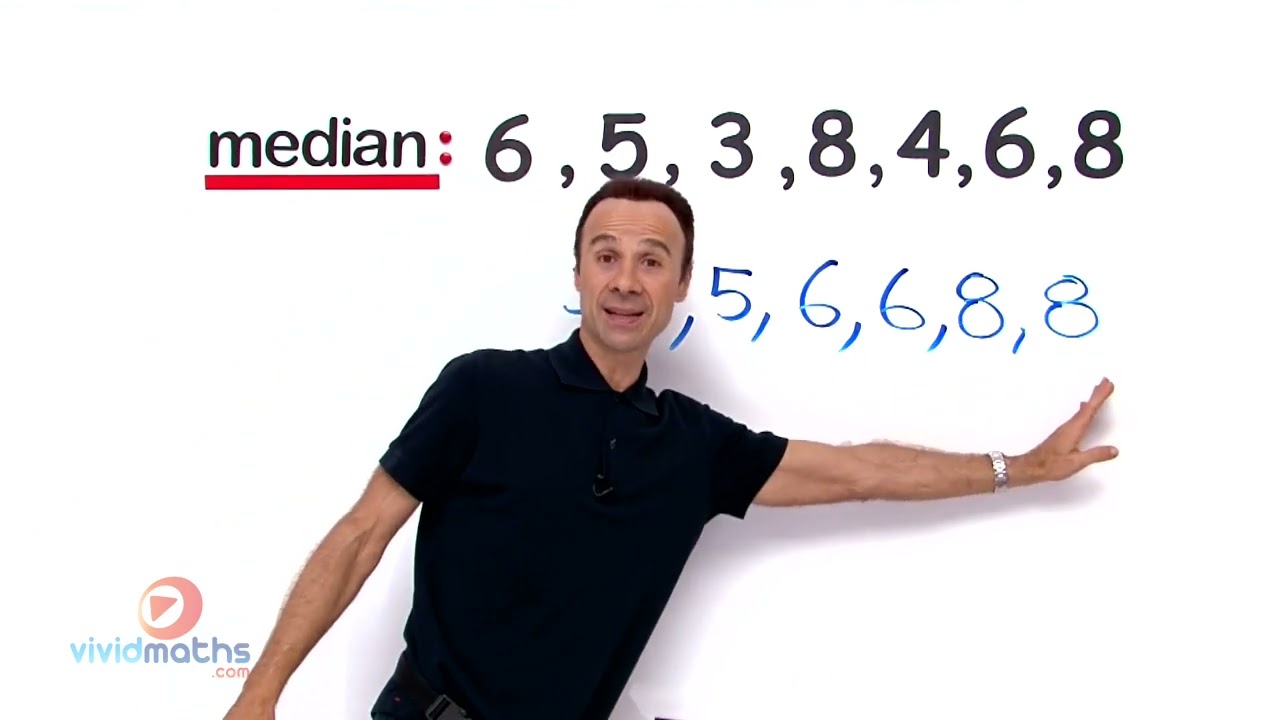
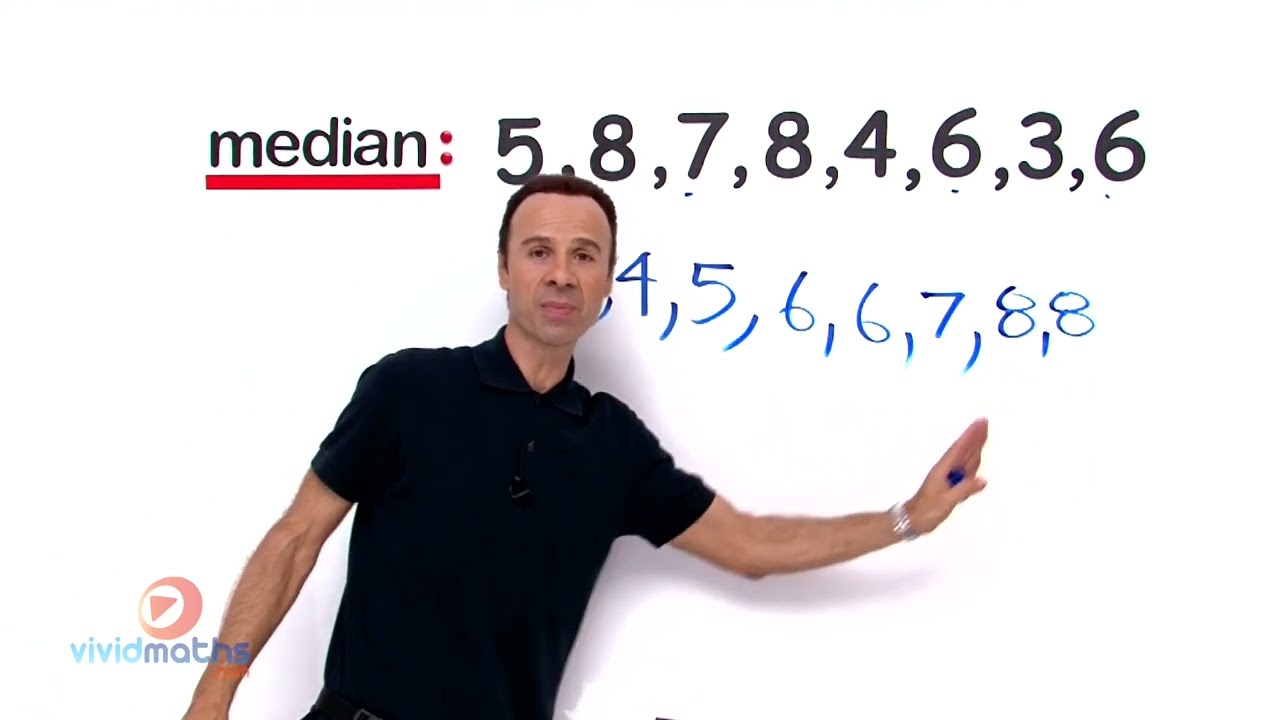
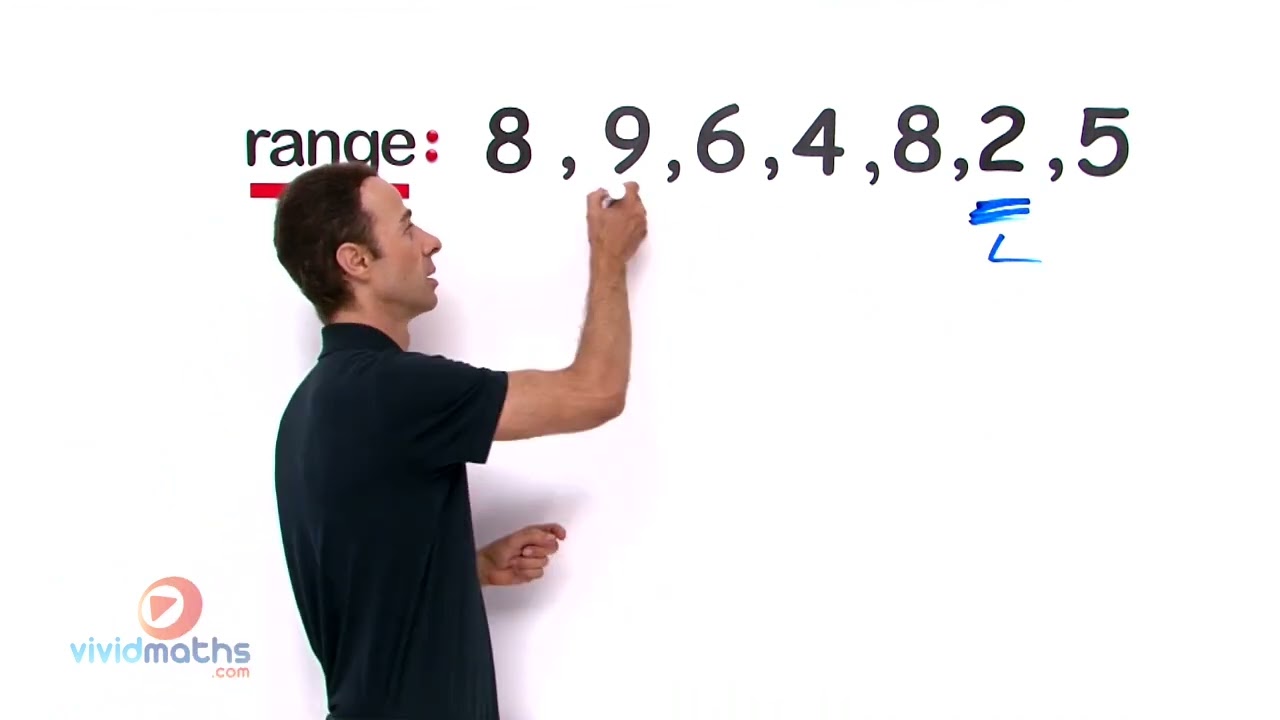
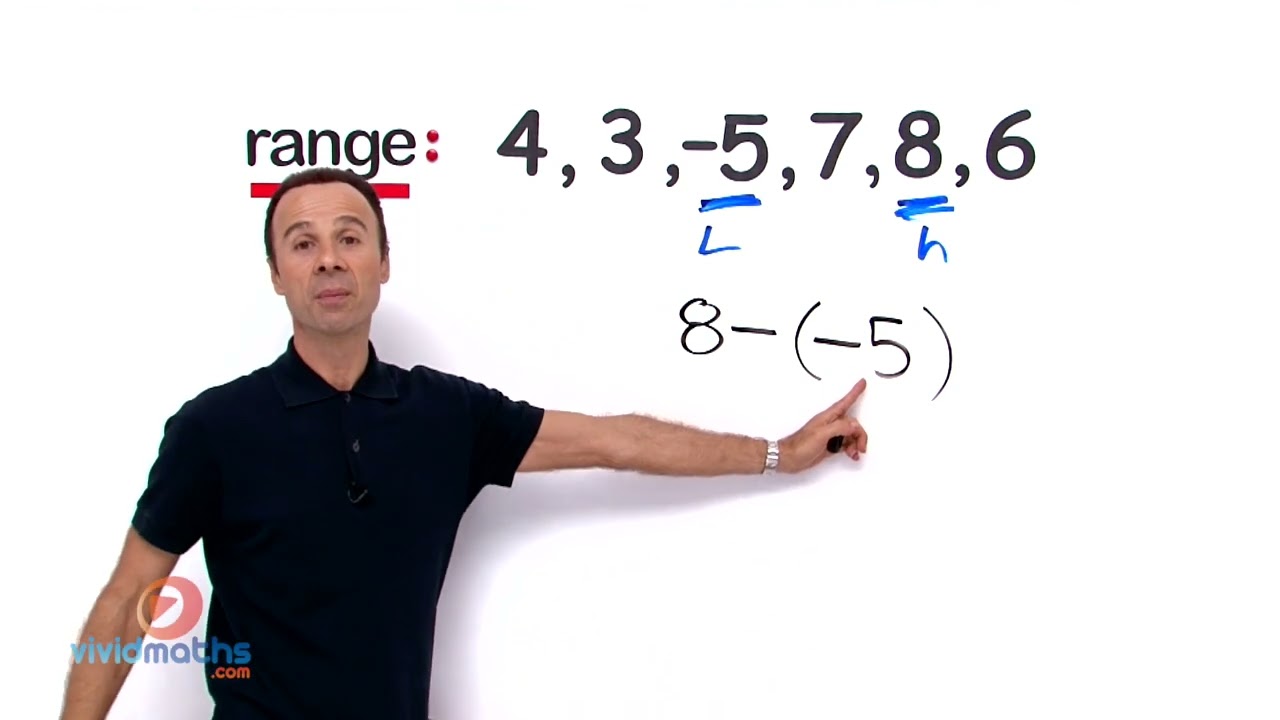
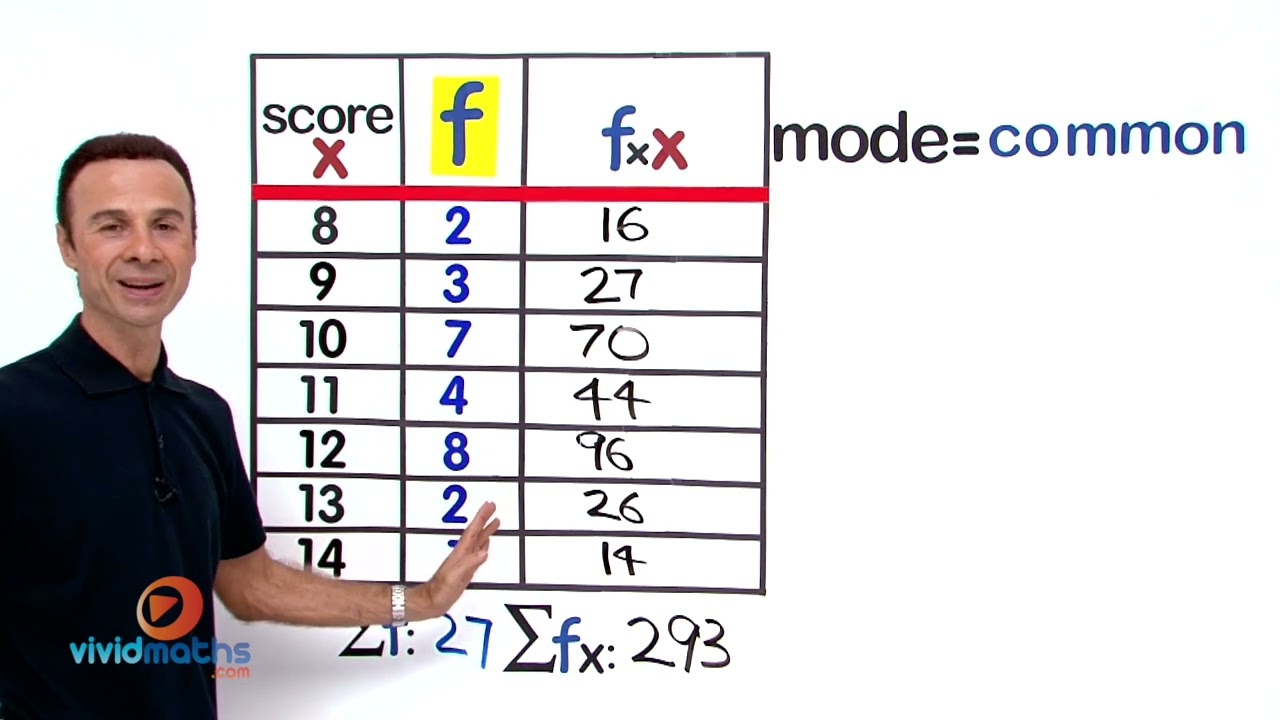
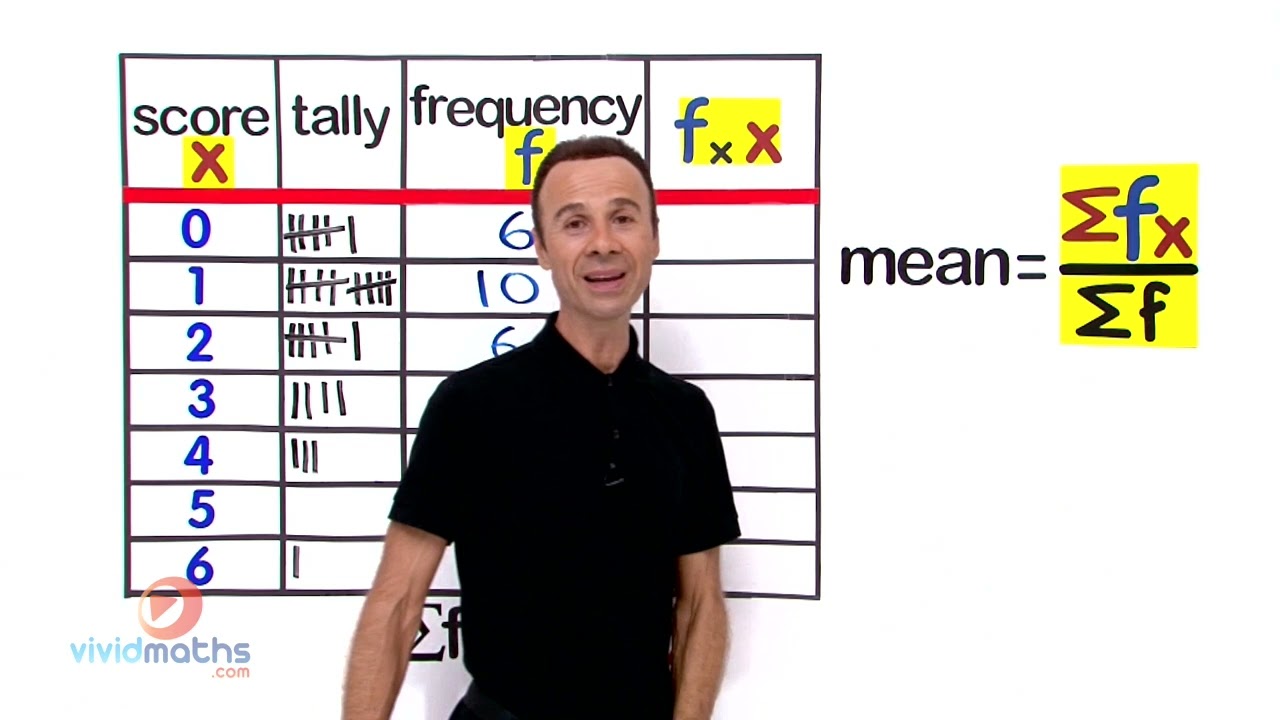
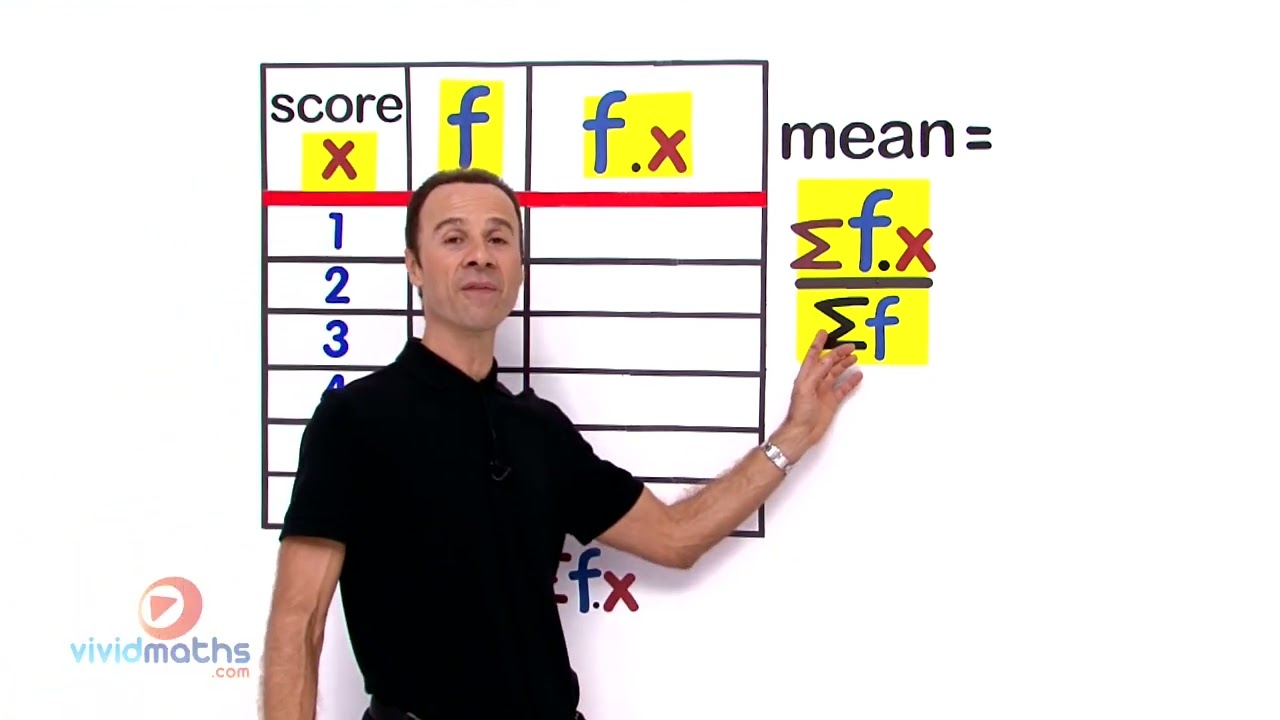
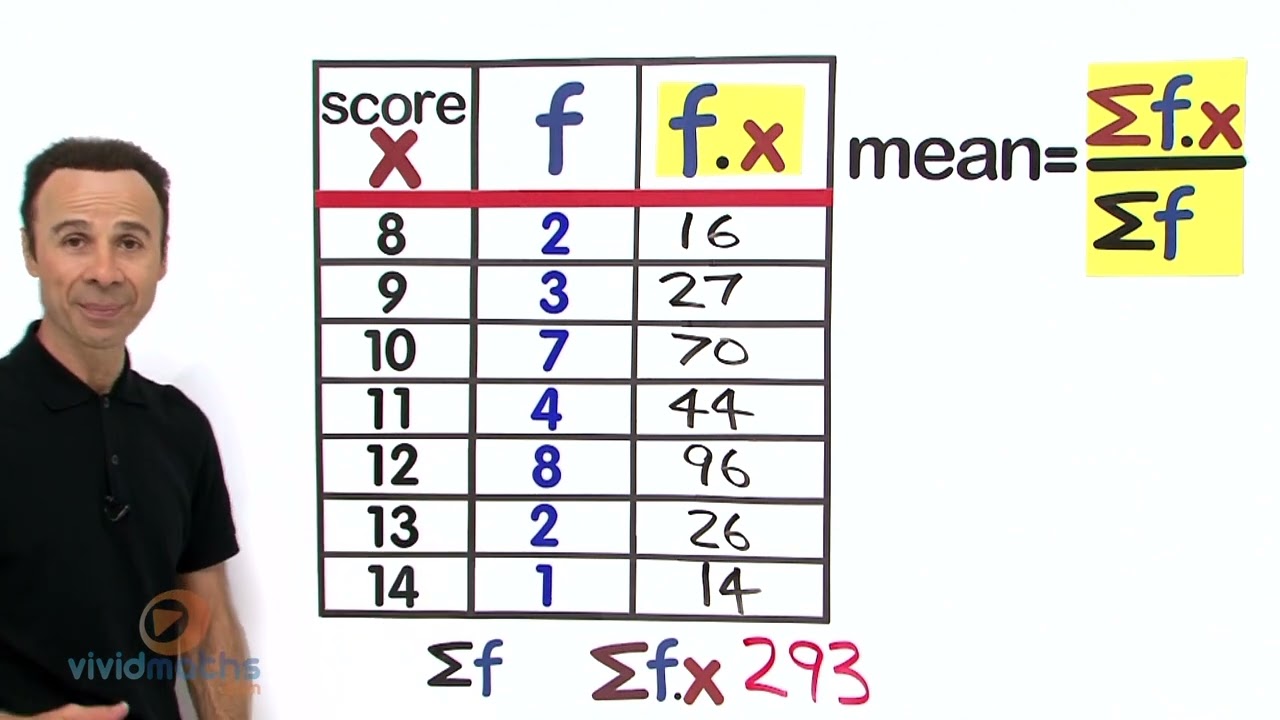
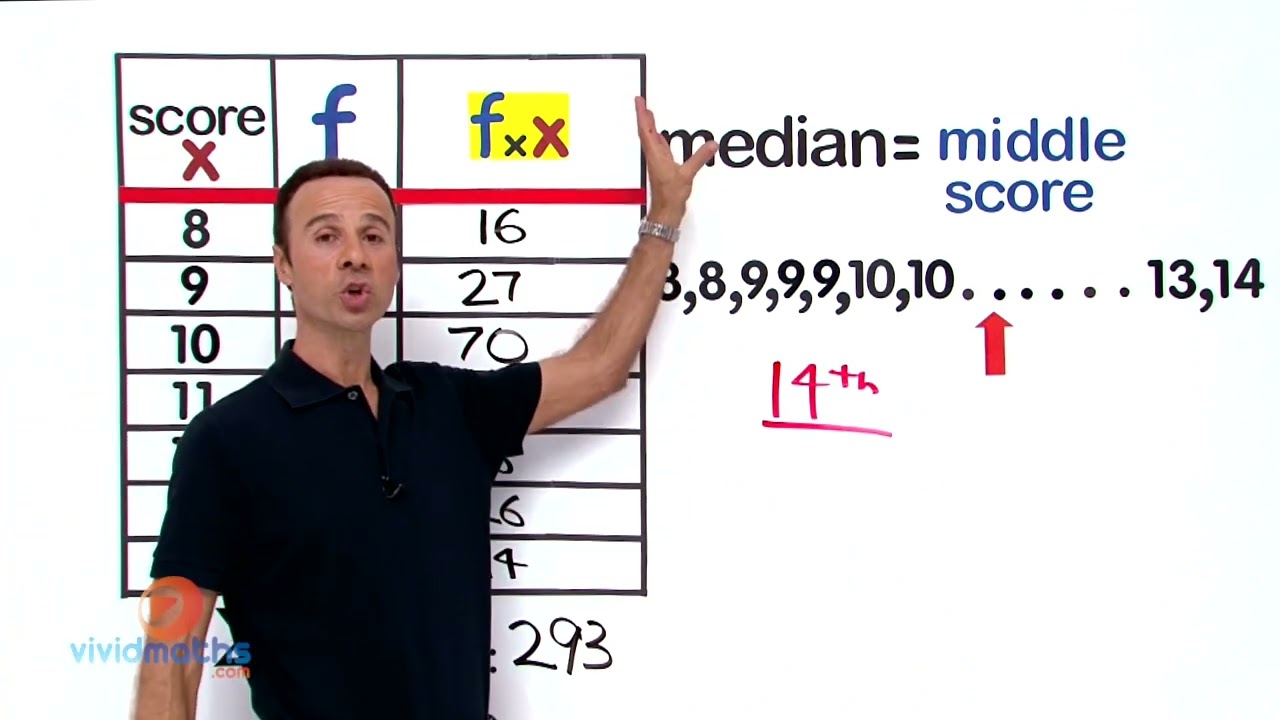
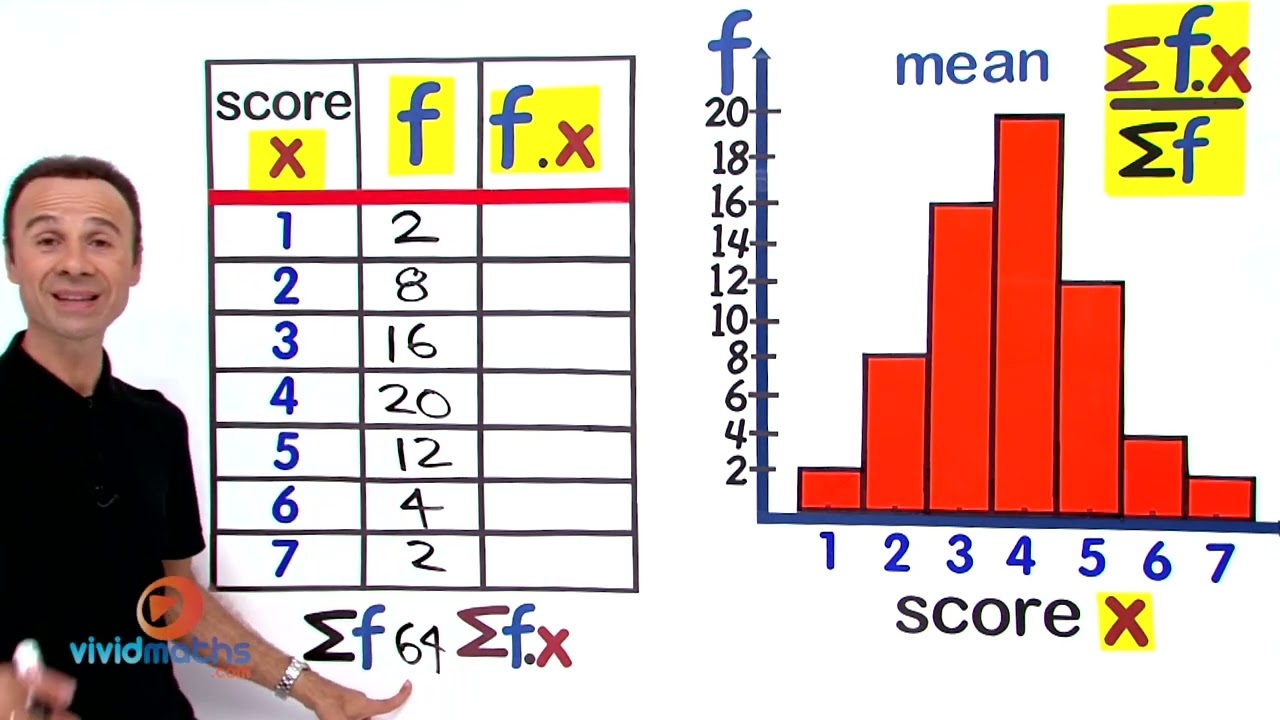
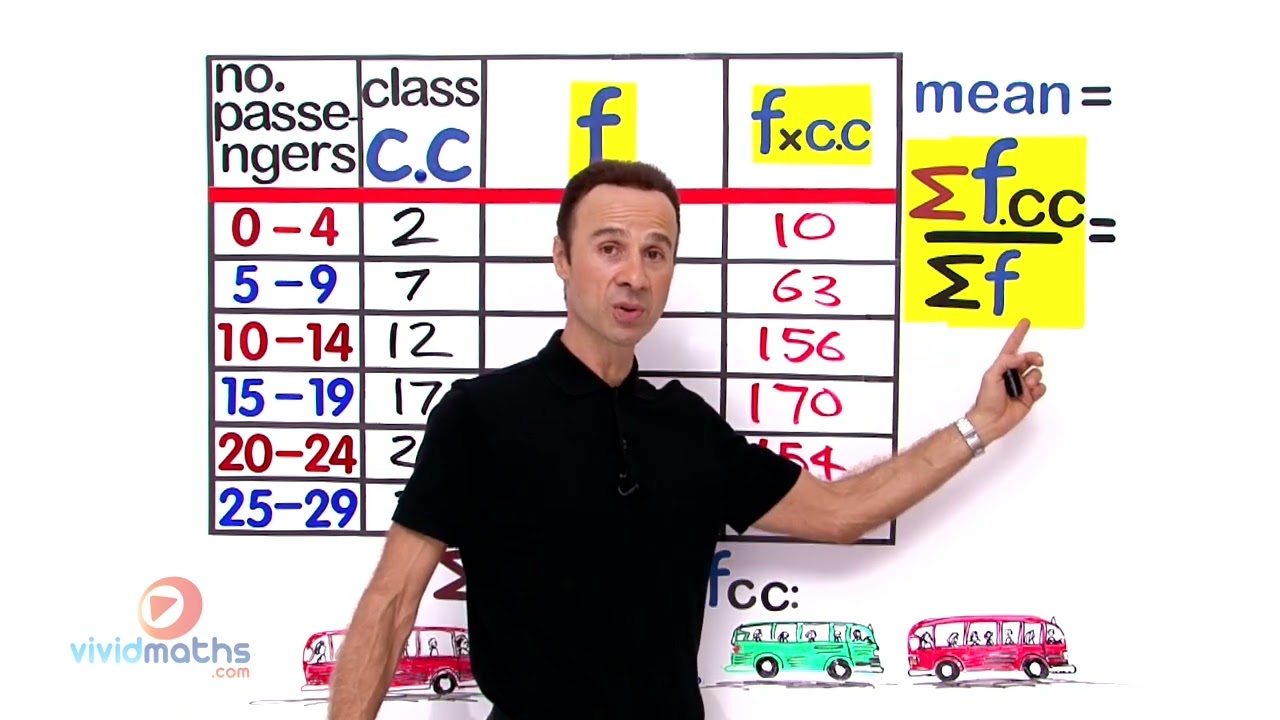
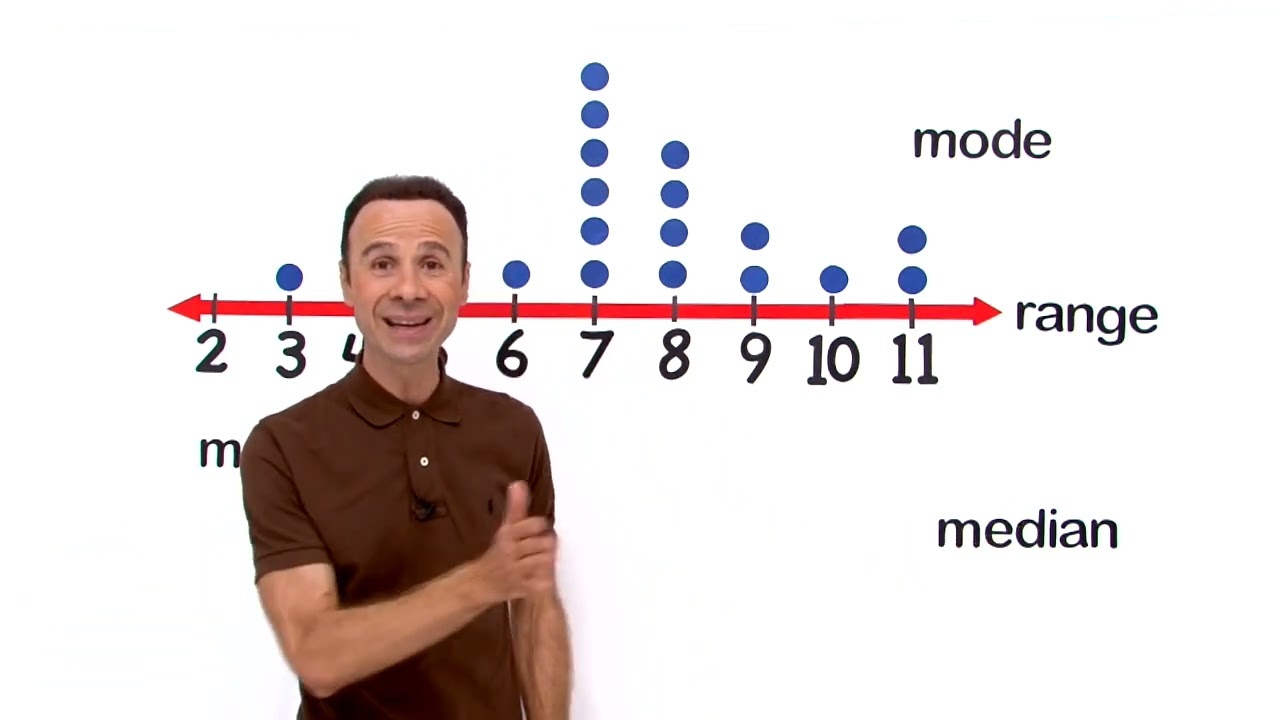
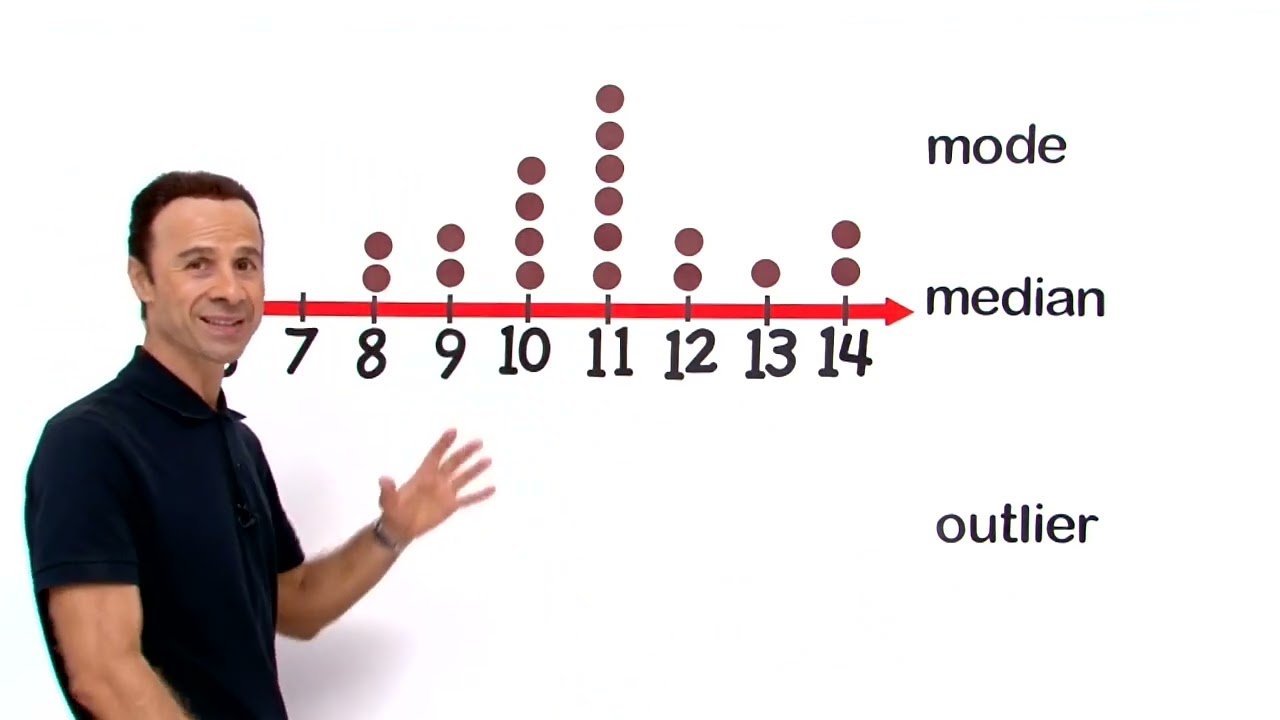
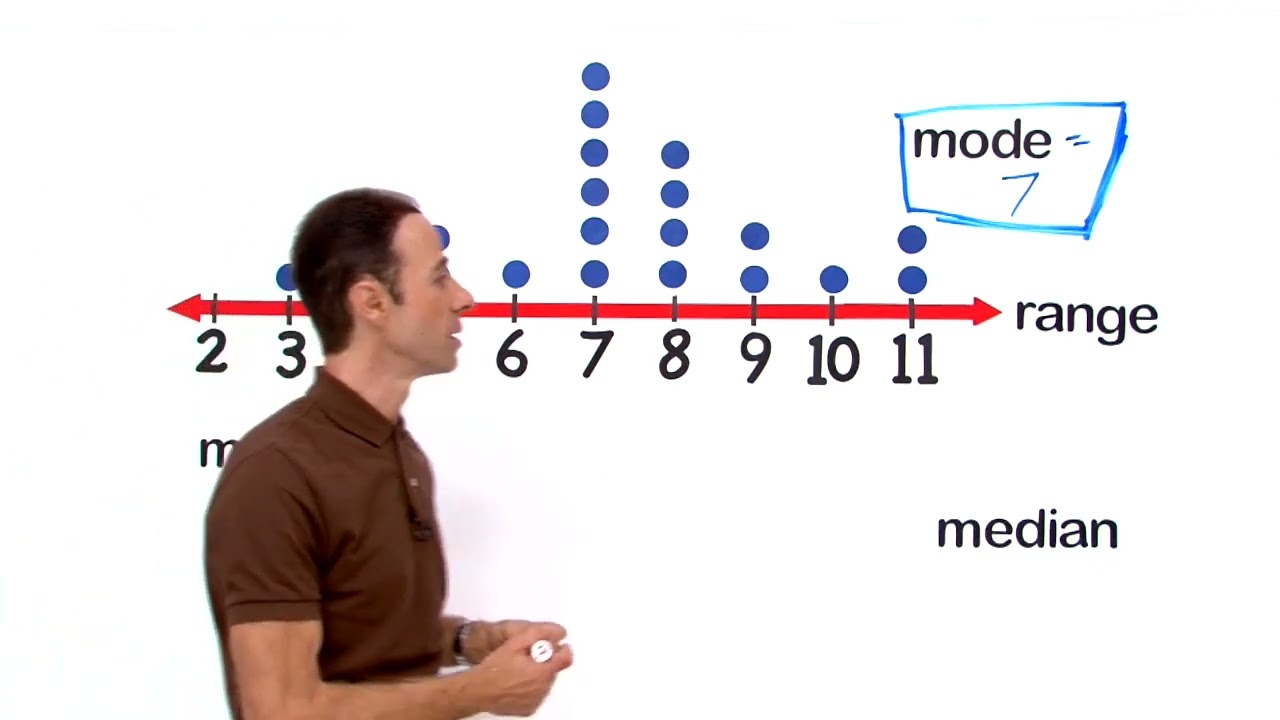
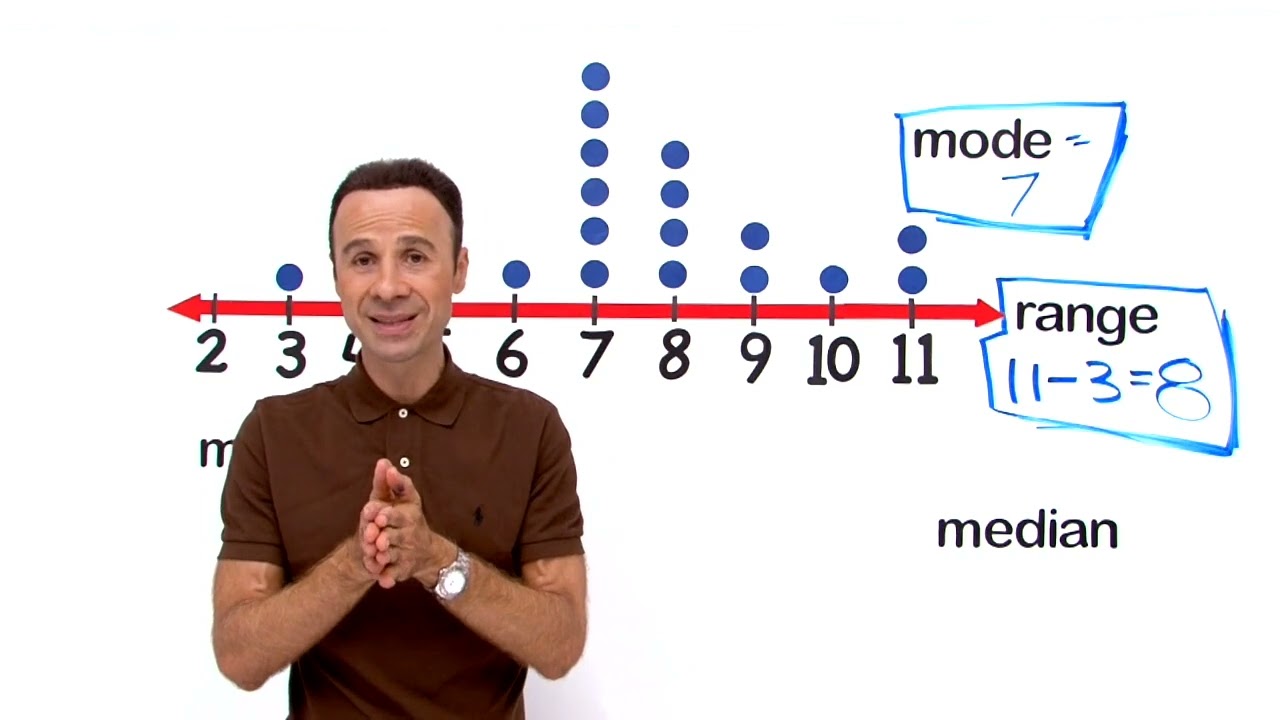
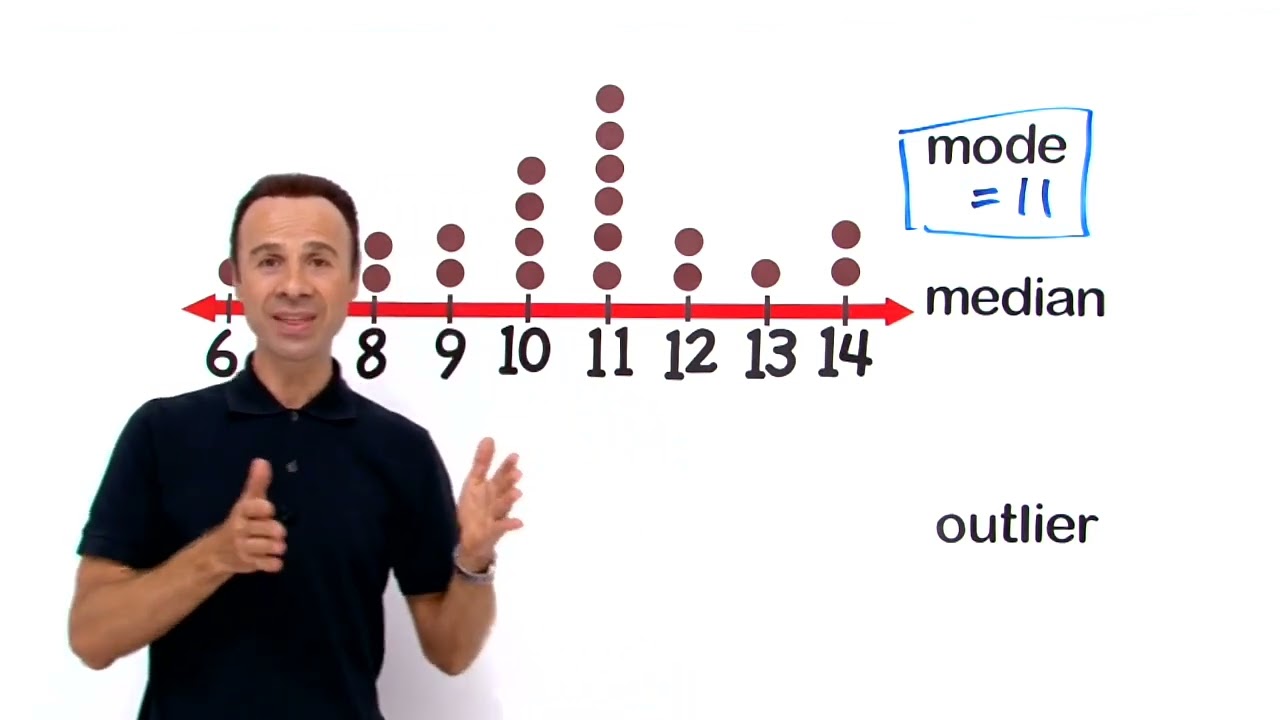
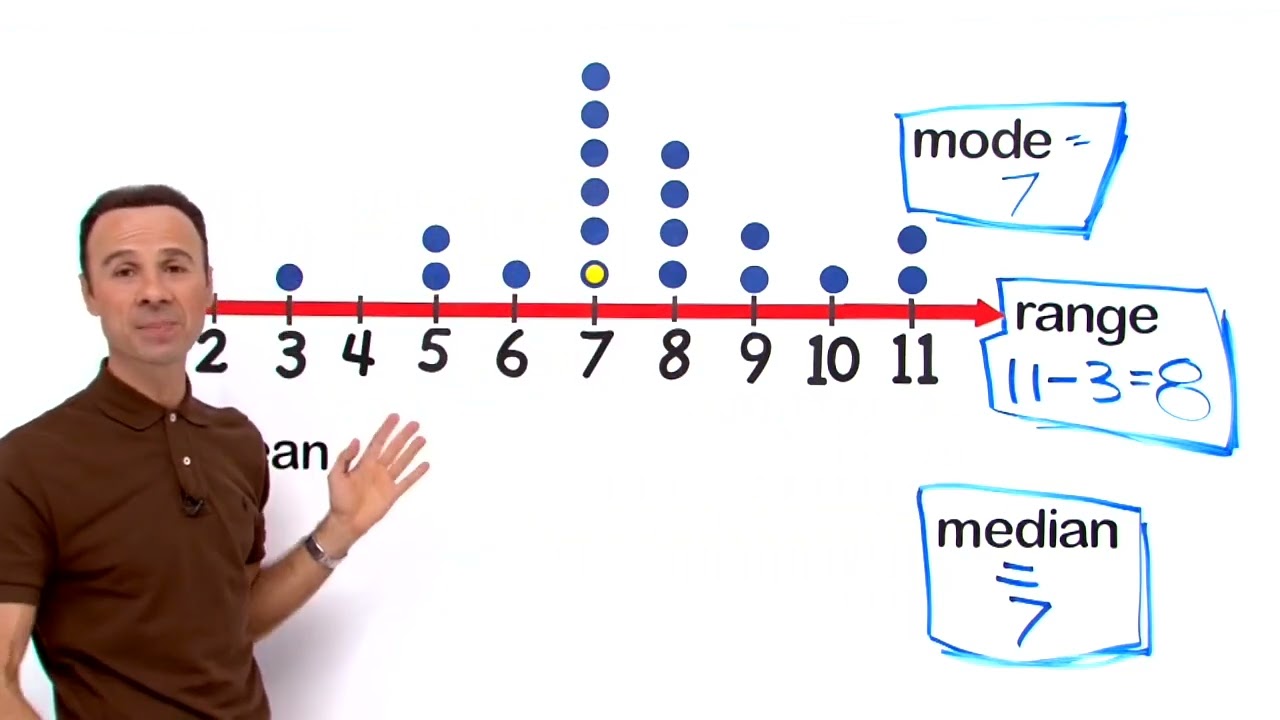
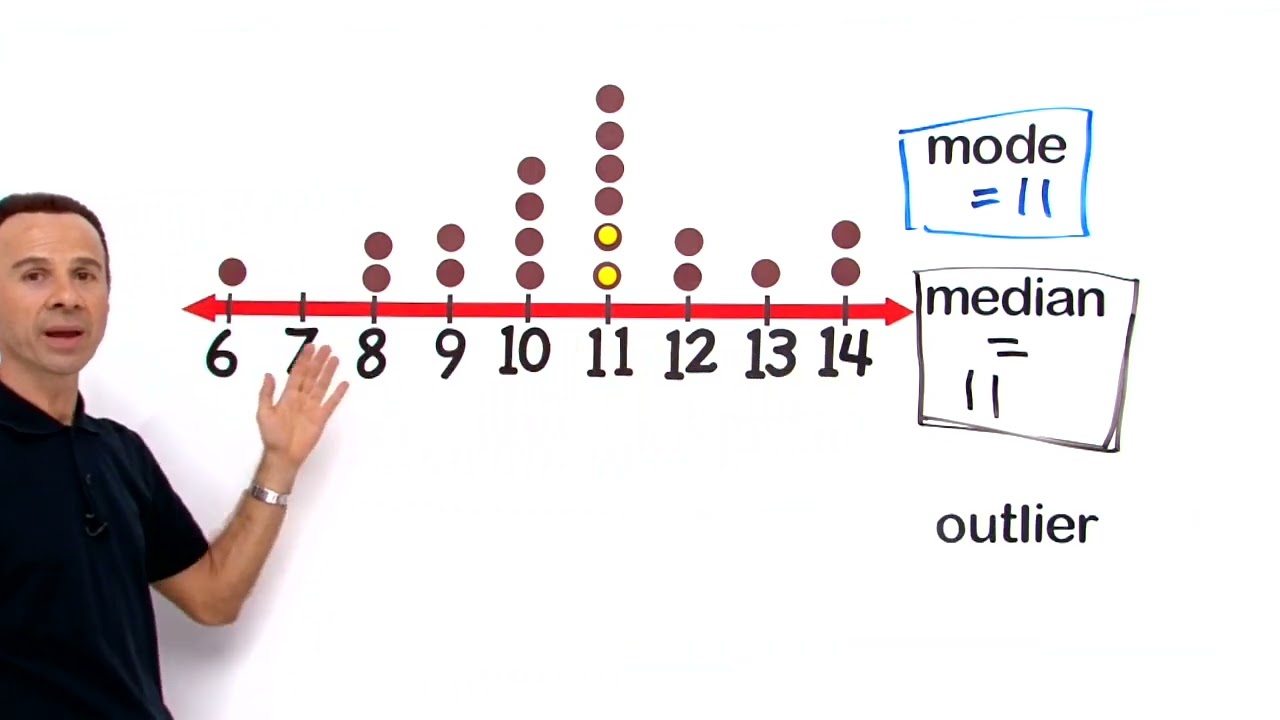
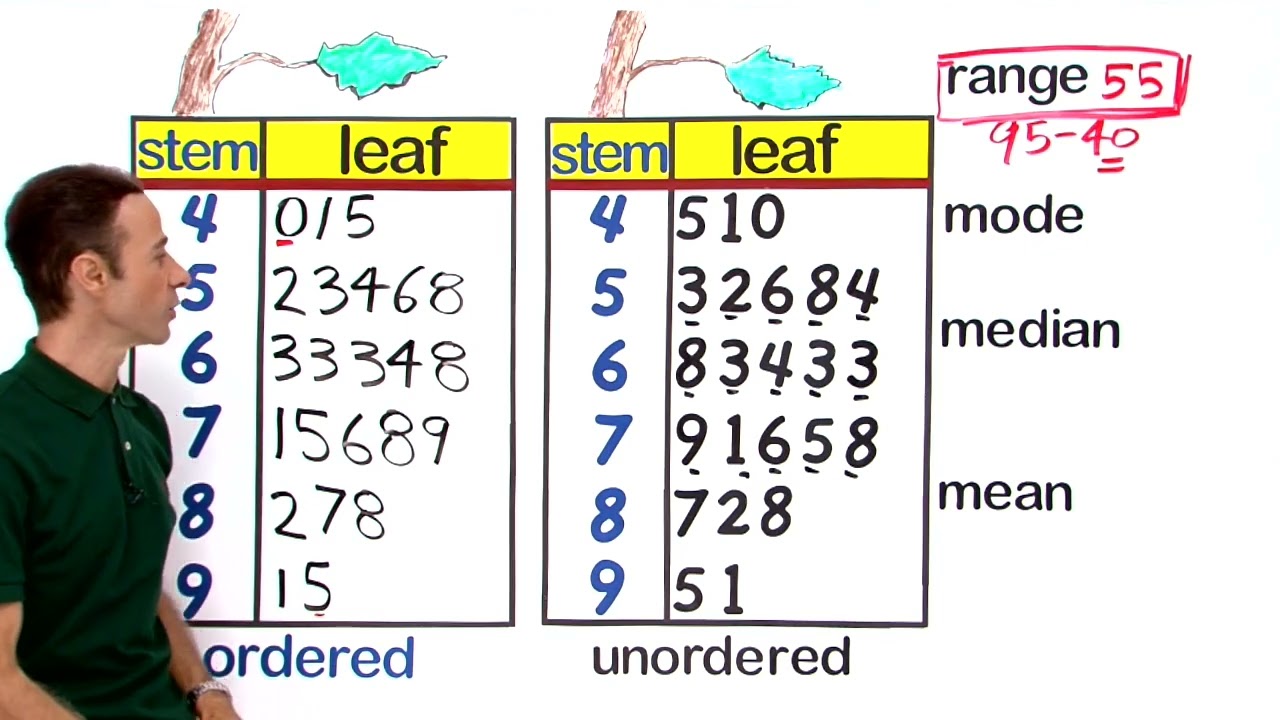
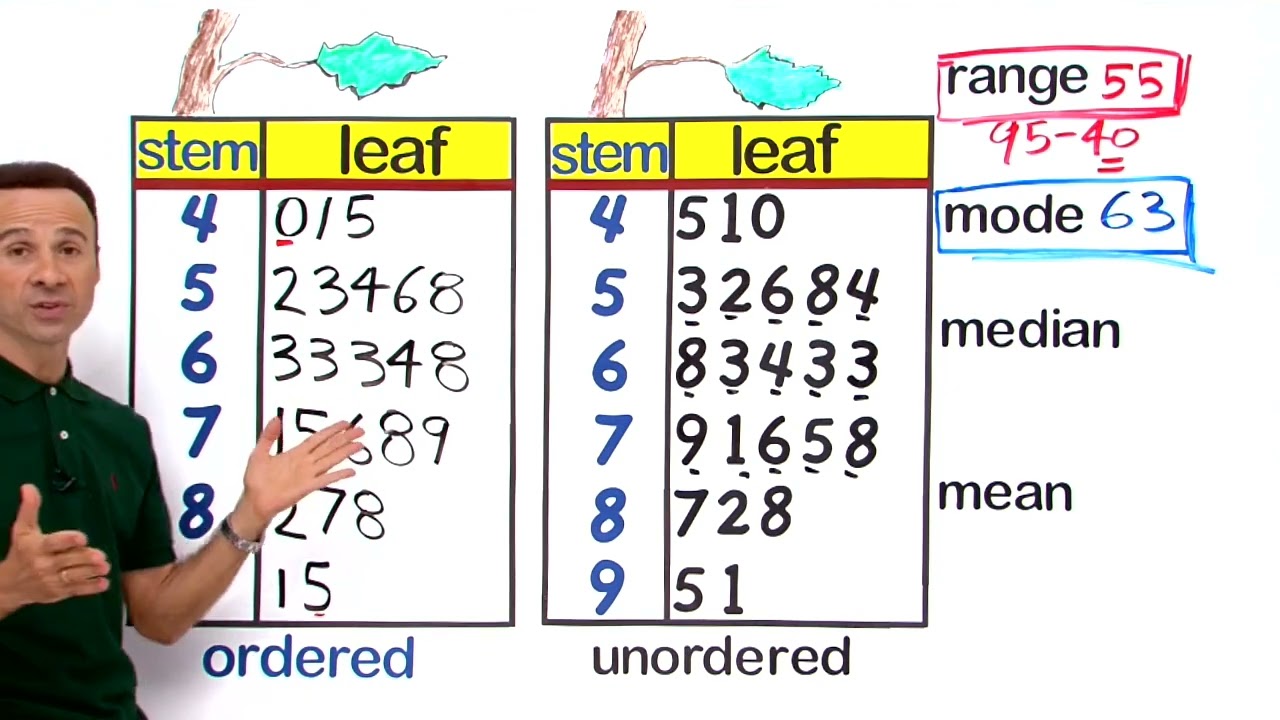
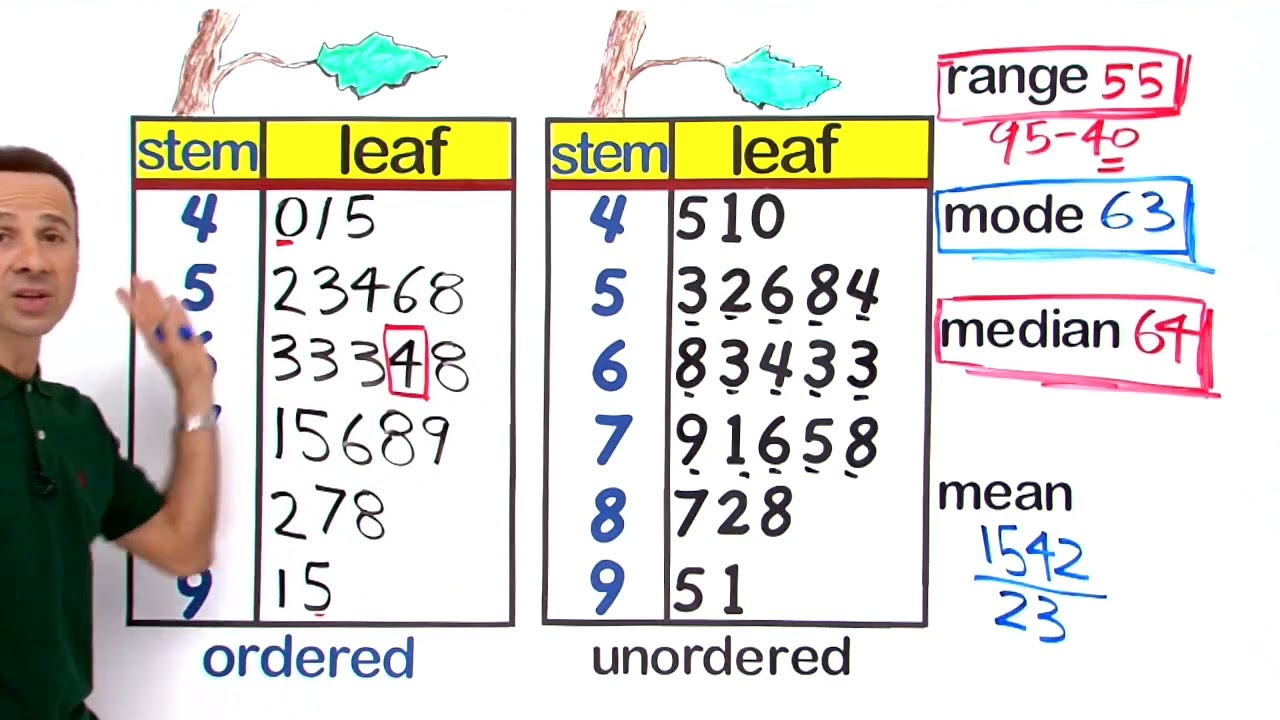
- Find Mean, Mode, Median and Range
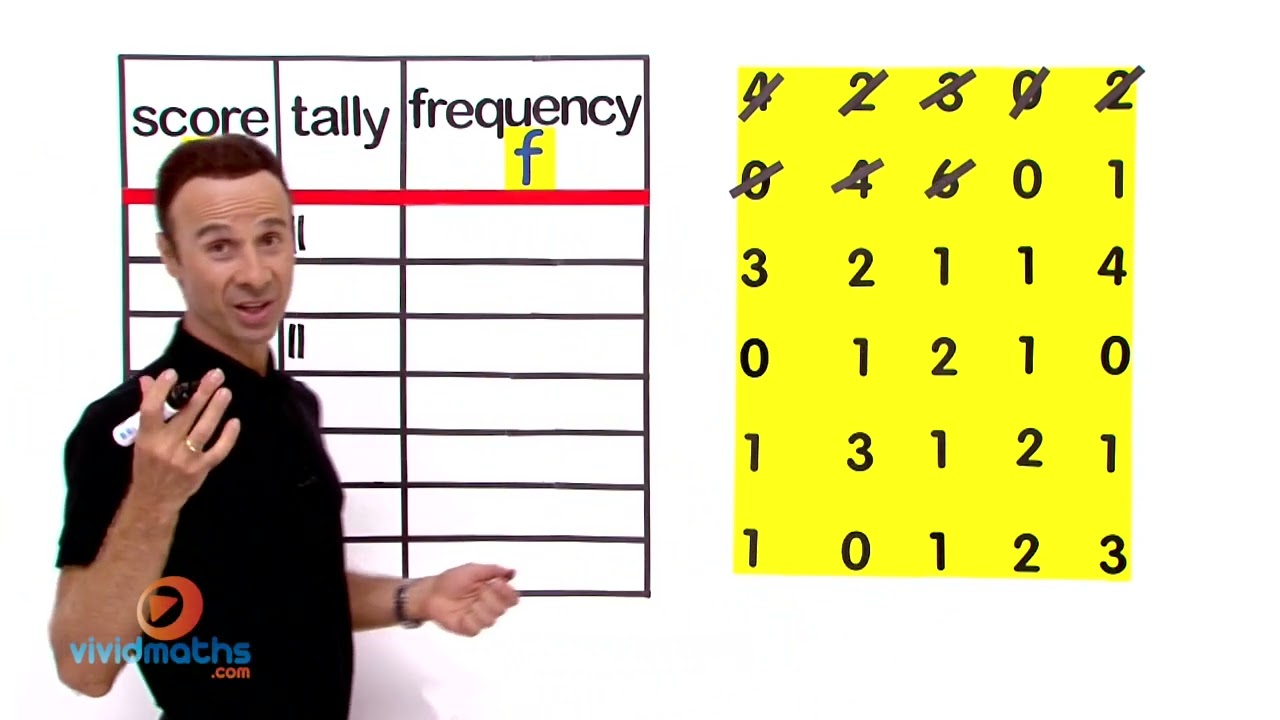
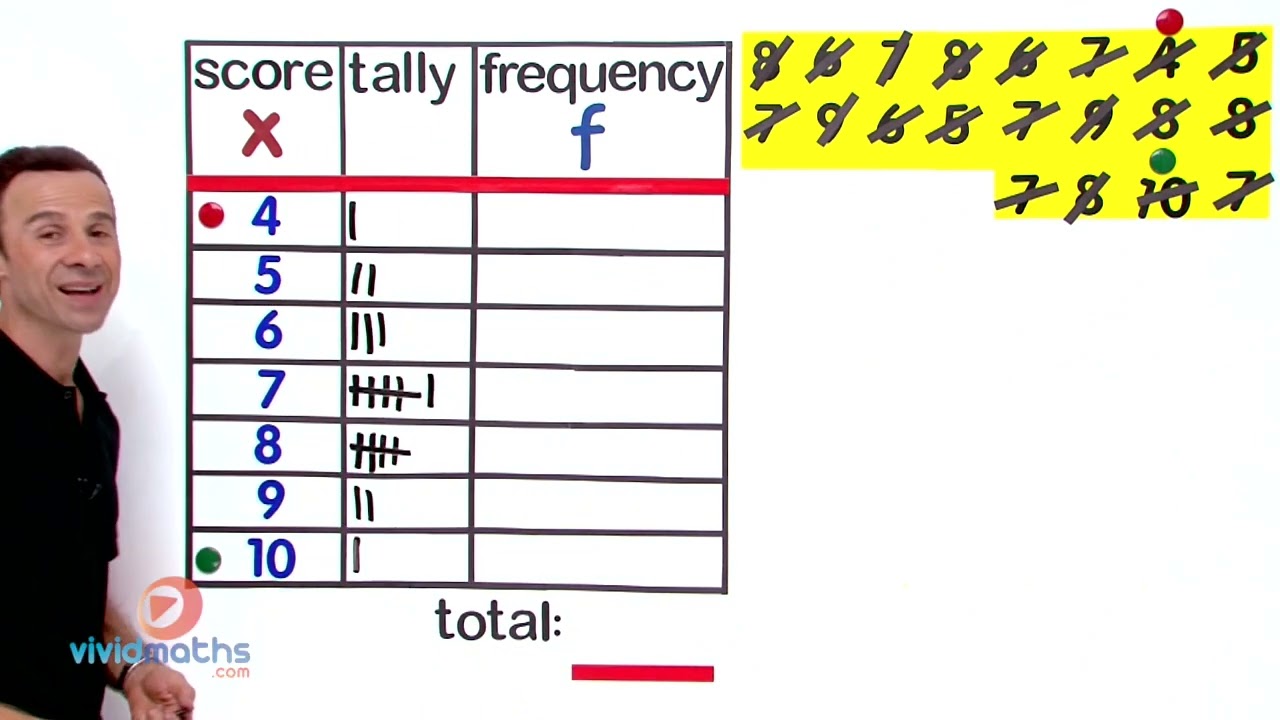
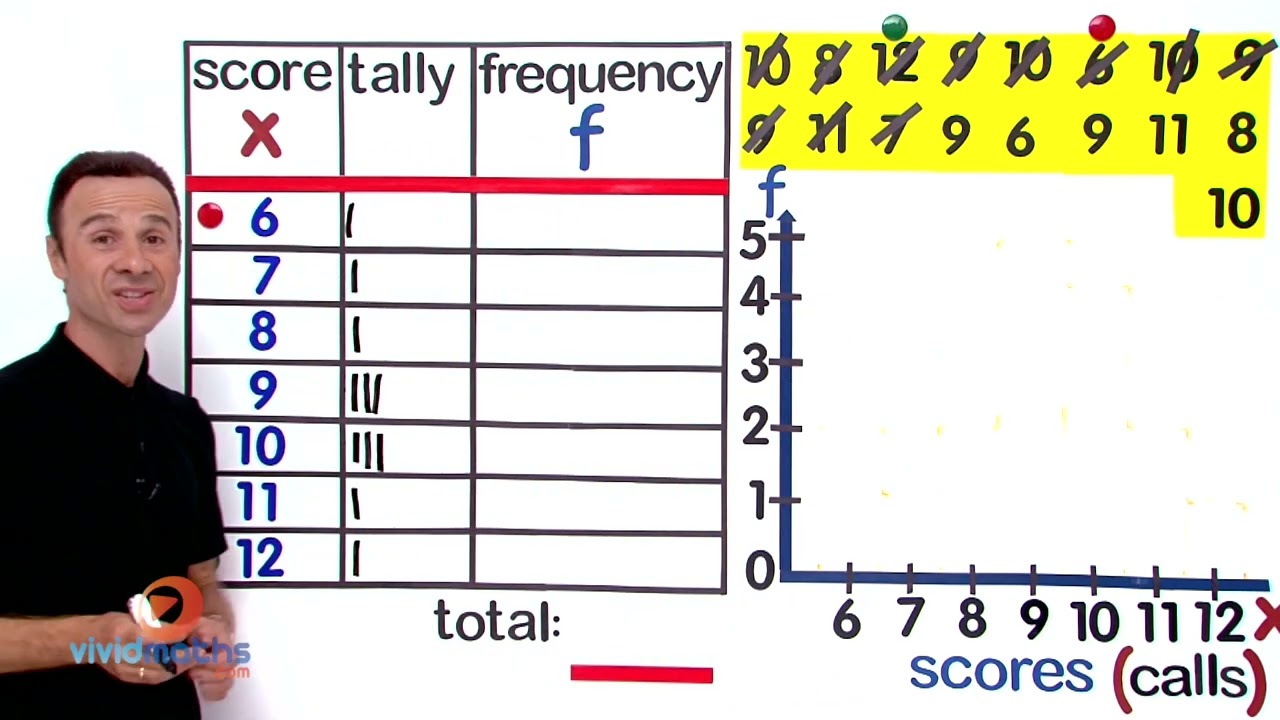
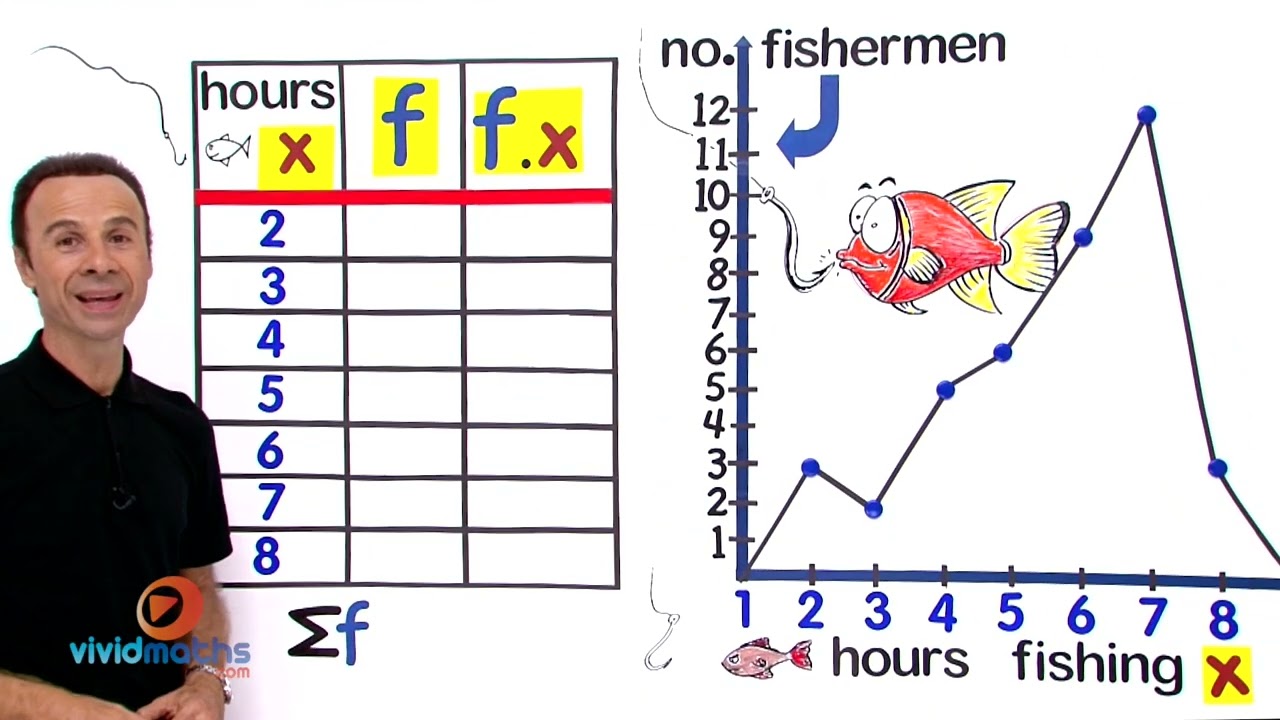
- Create Frequency Tables & Graphs
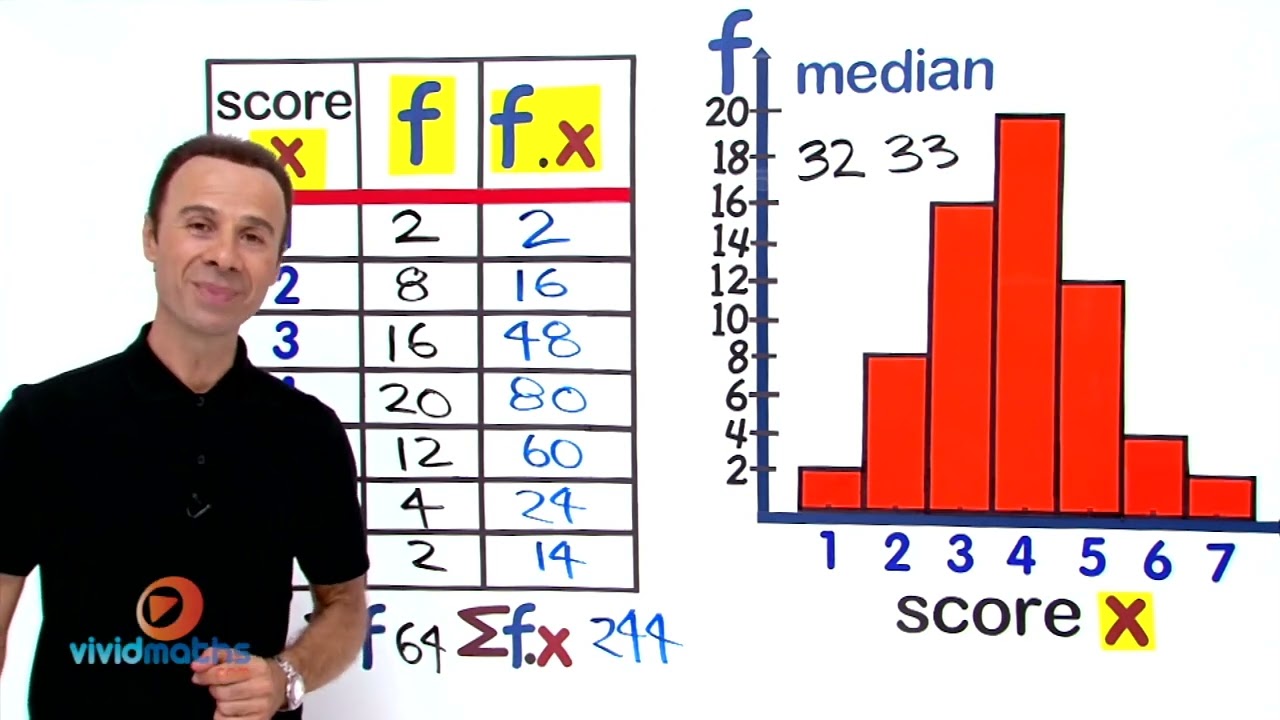
- Interpret Frequency Tables
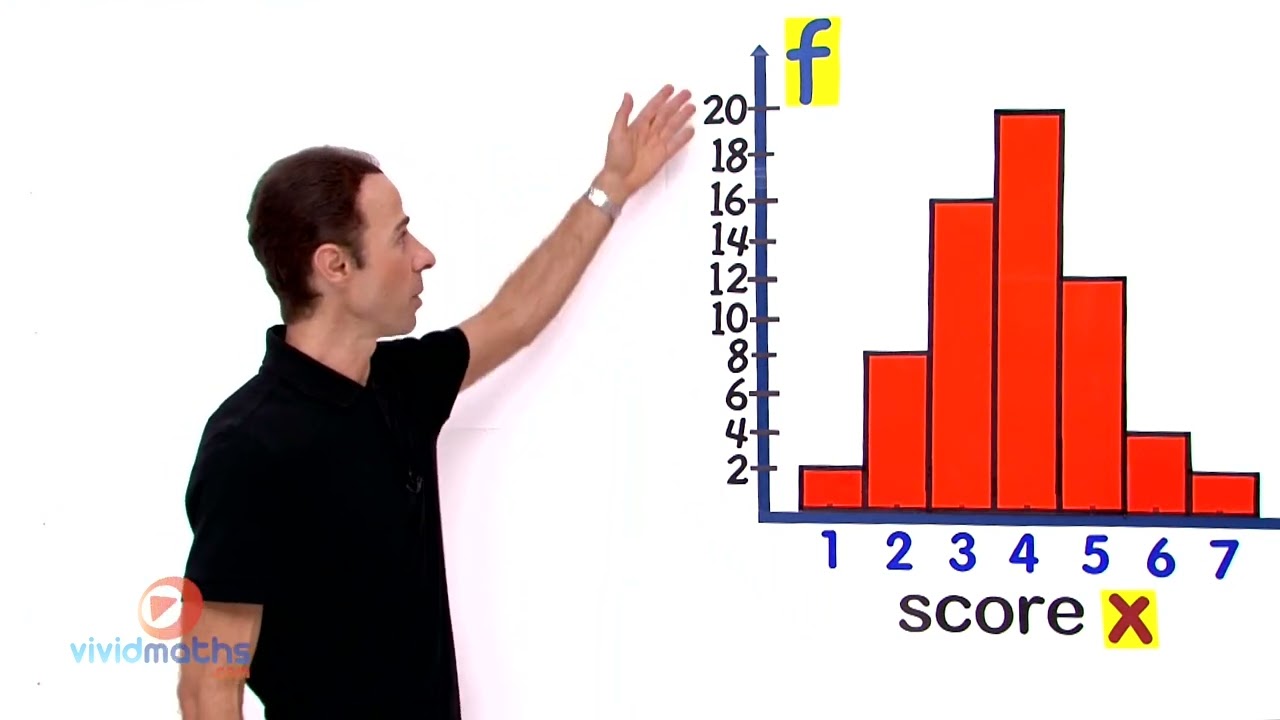
- Create and Interpret Bar & Line Graphs (Histograms)
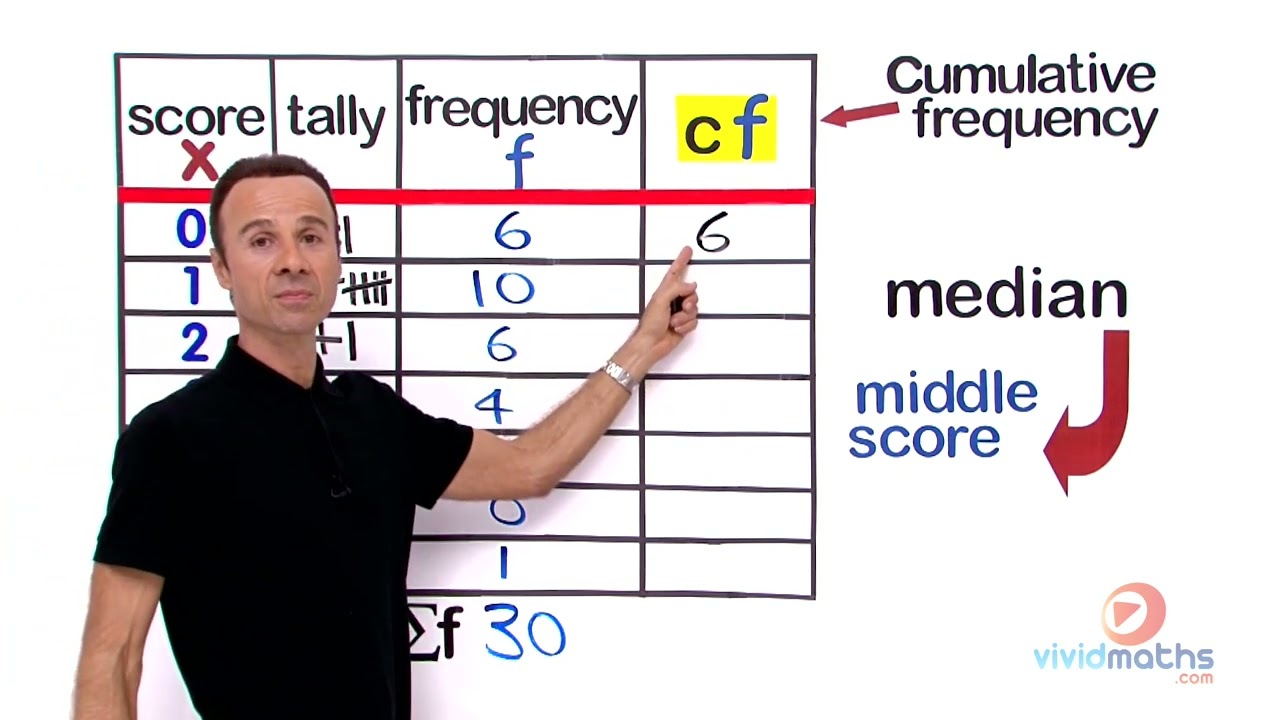
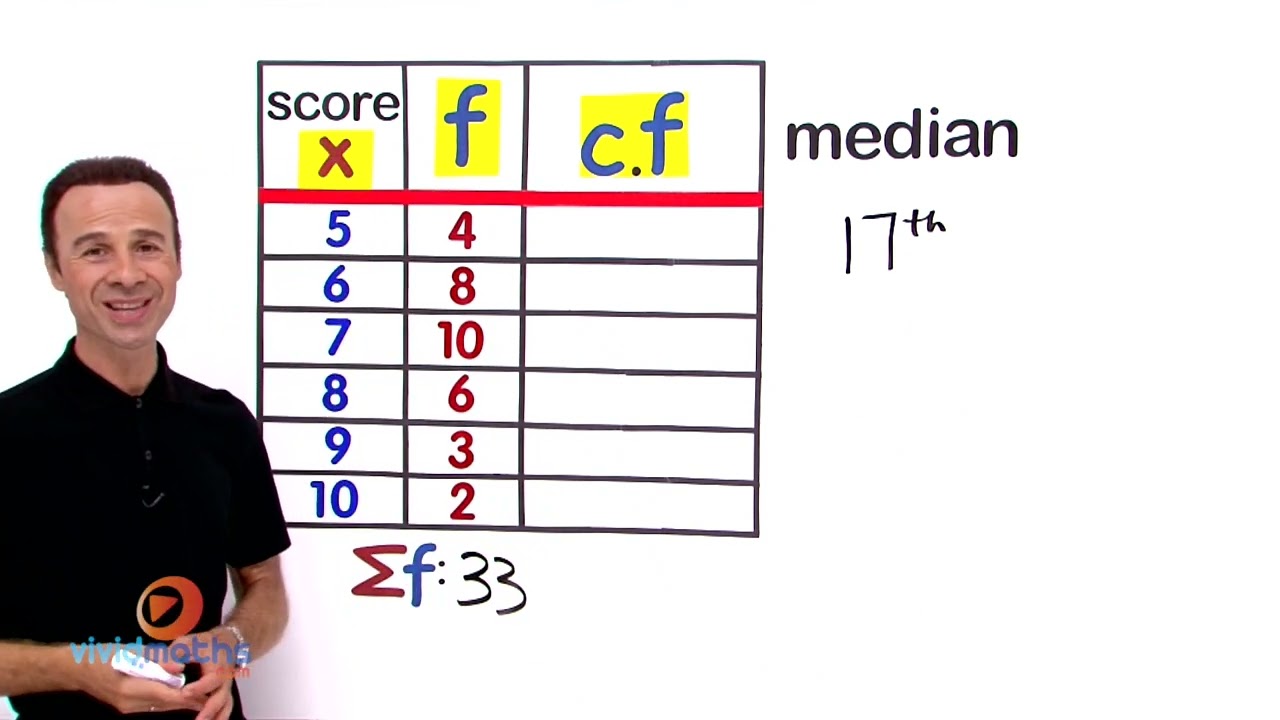
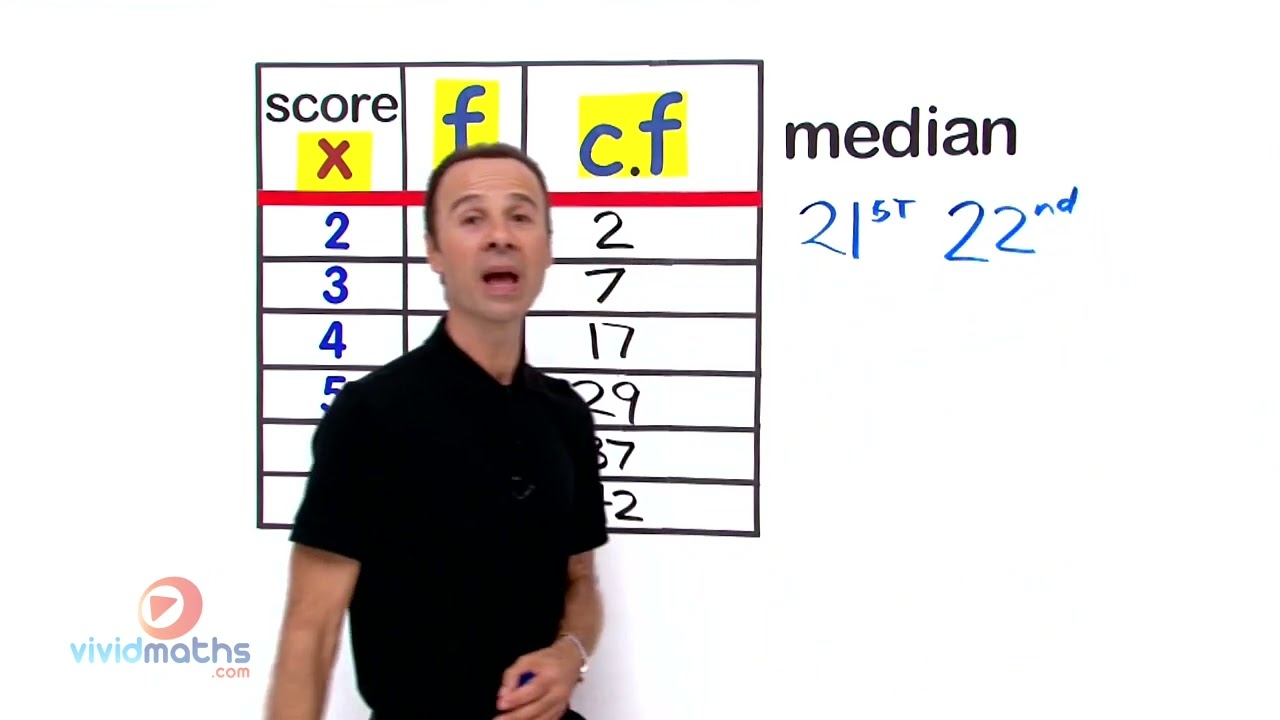
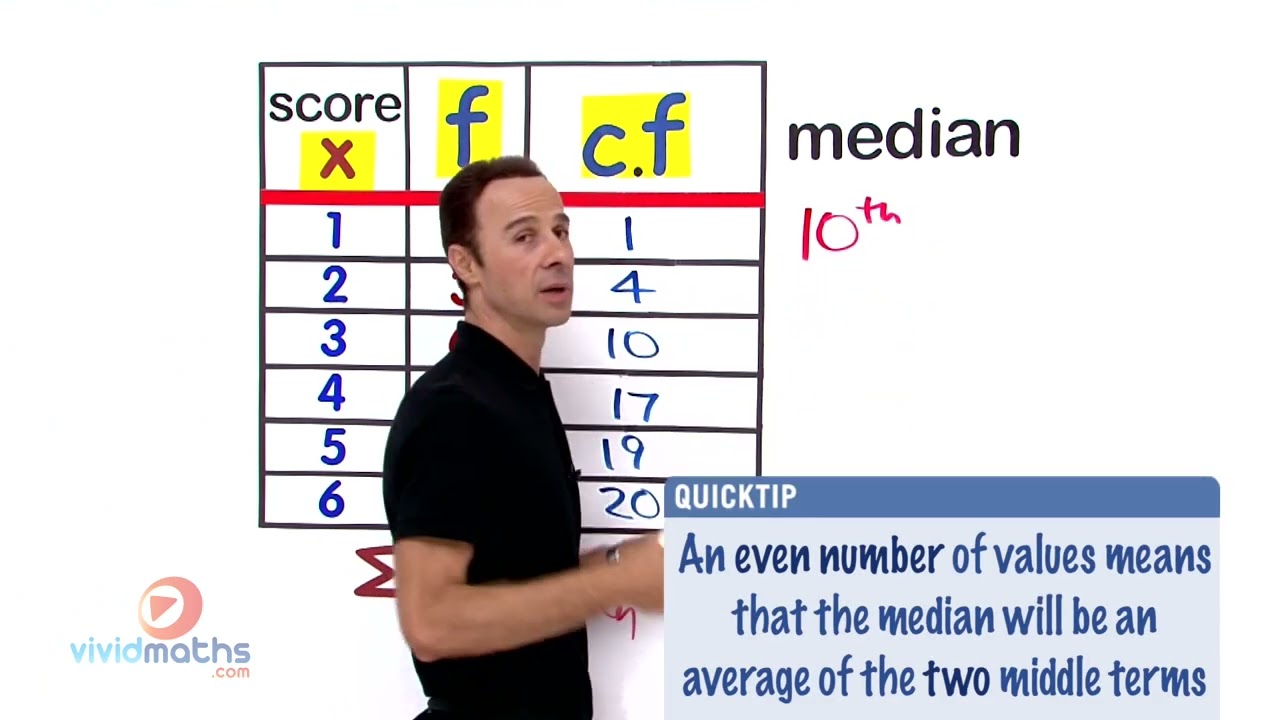
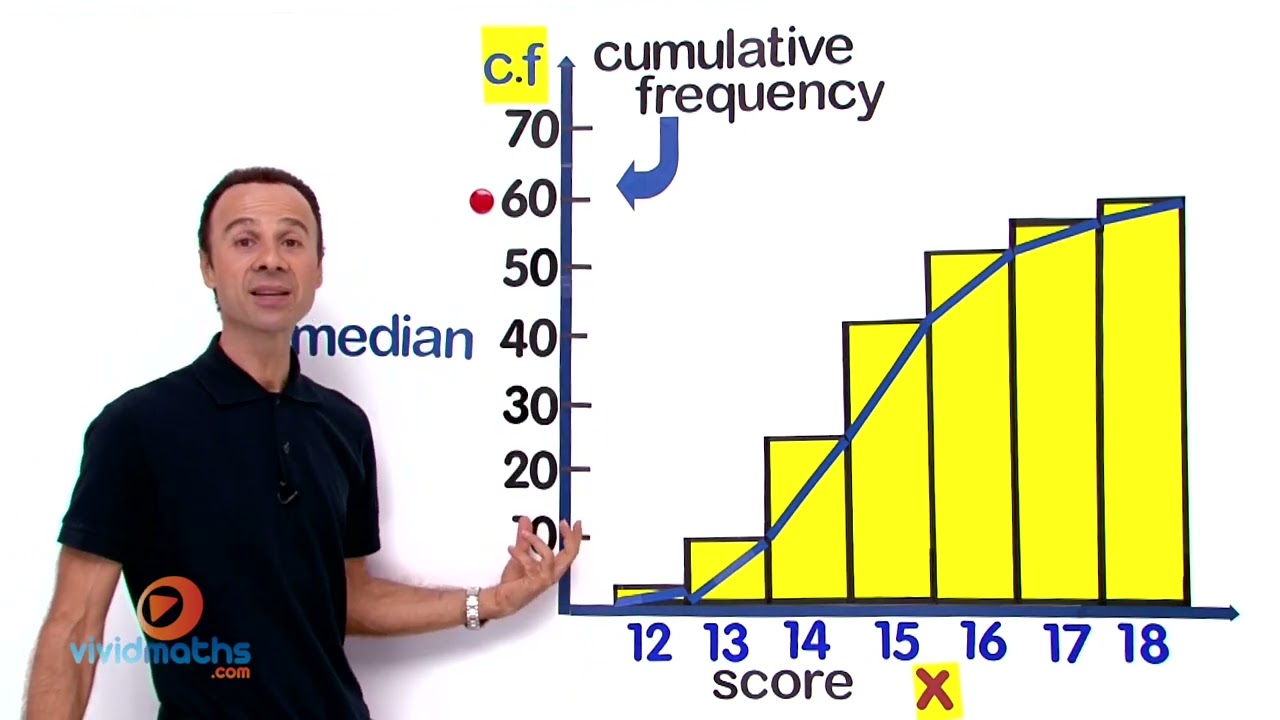
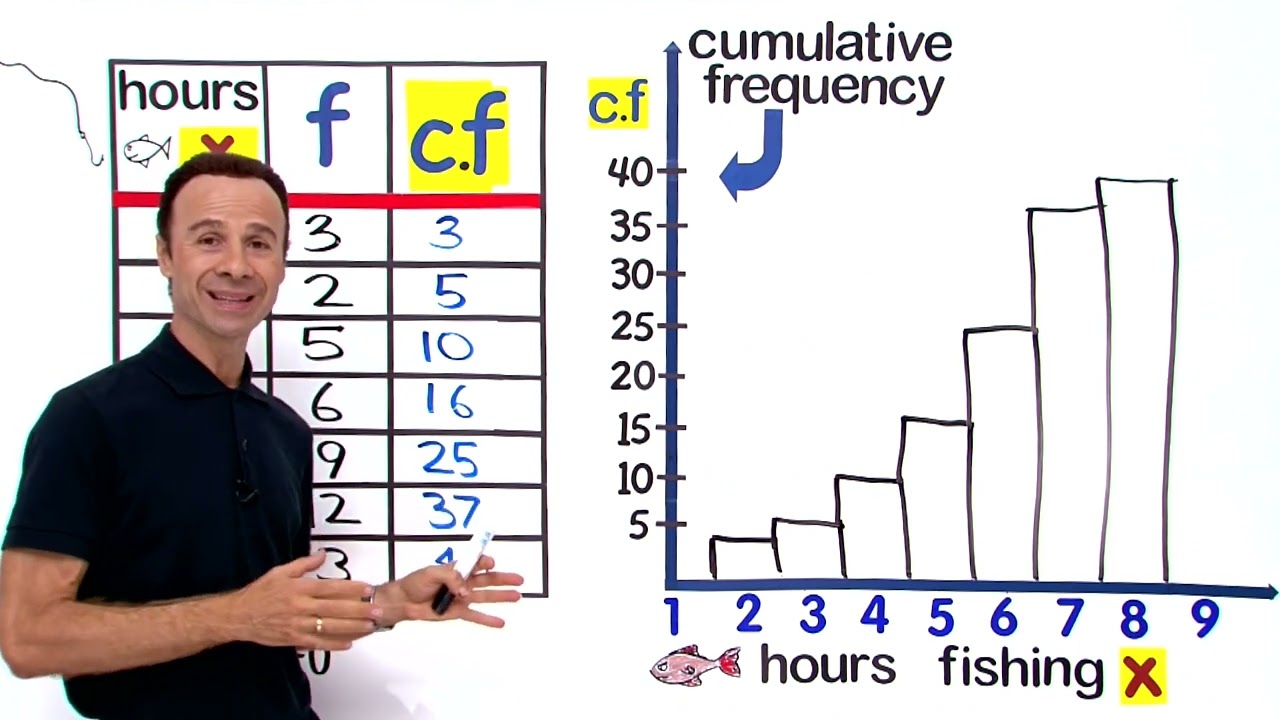
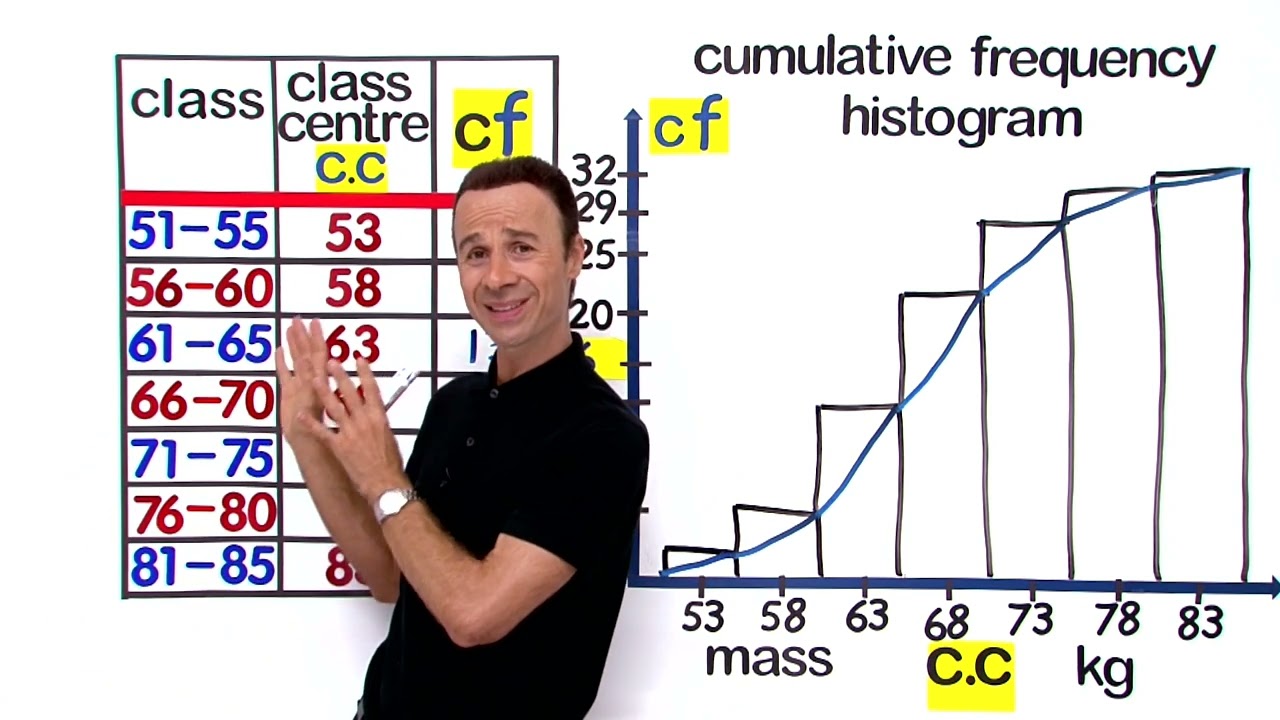
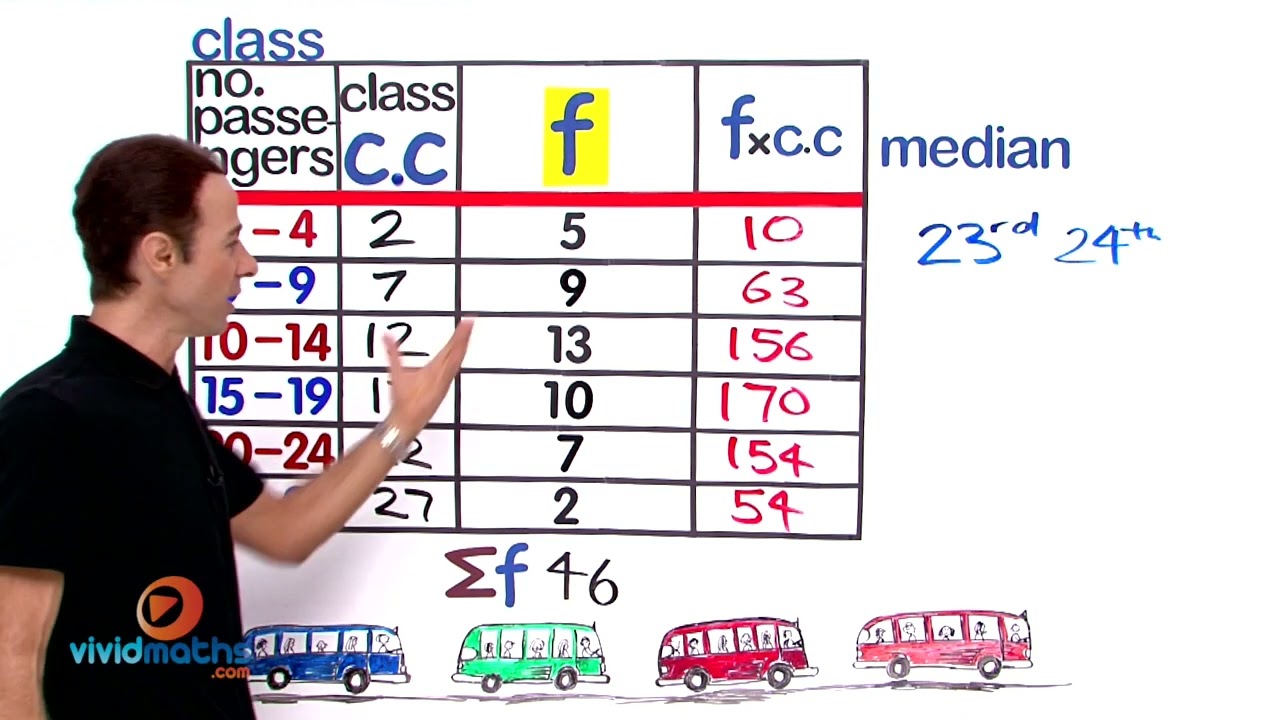
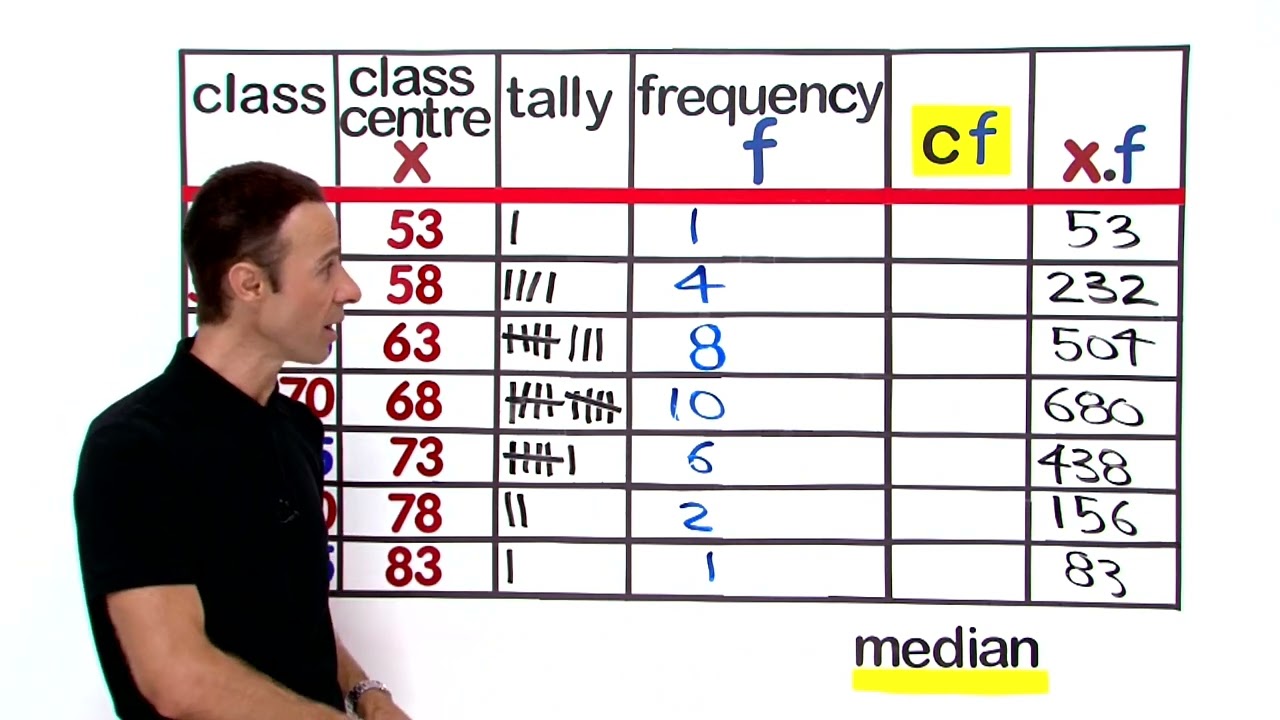
- Interpret Cumulative Frequency Tables and Charts
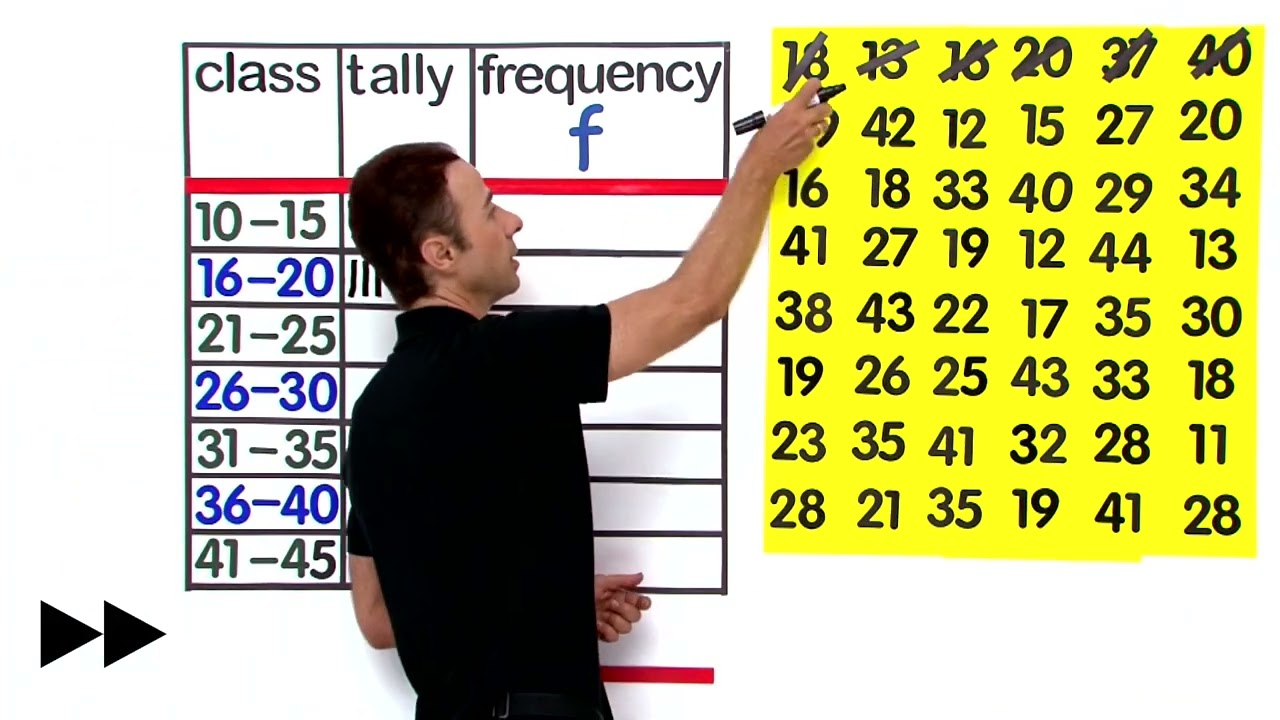
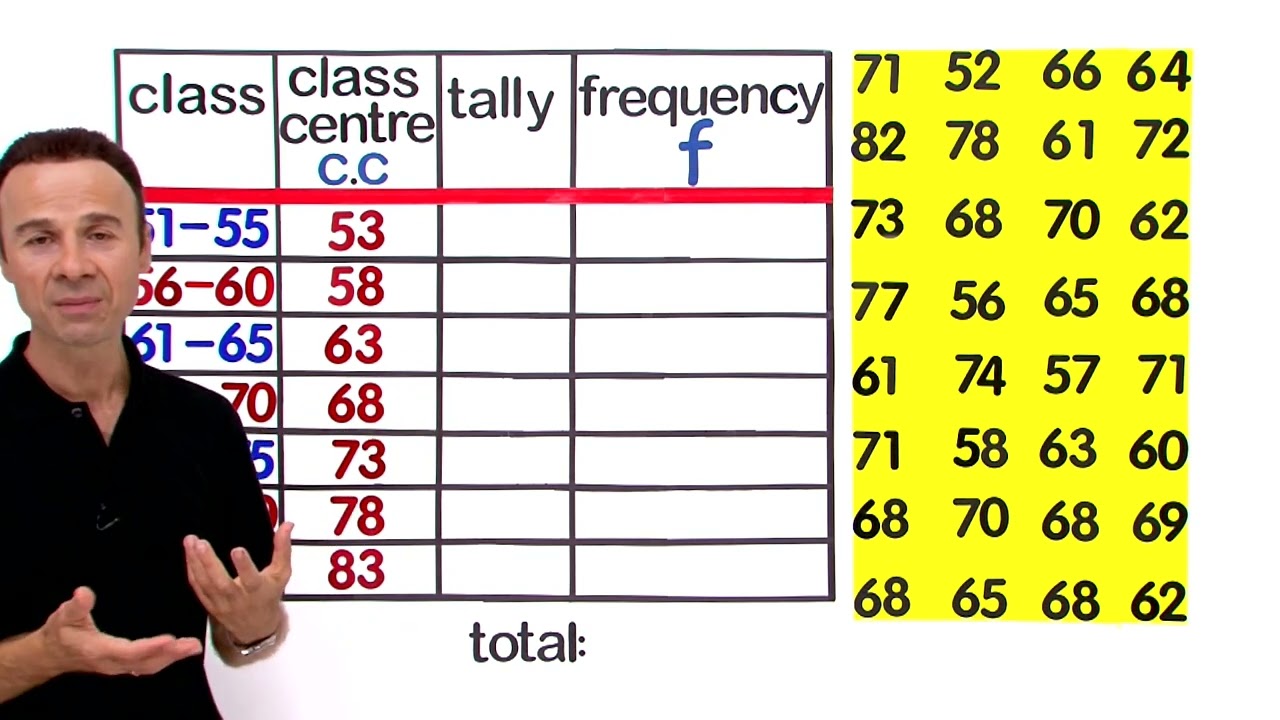
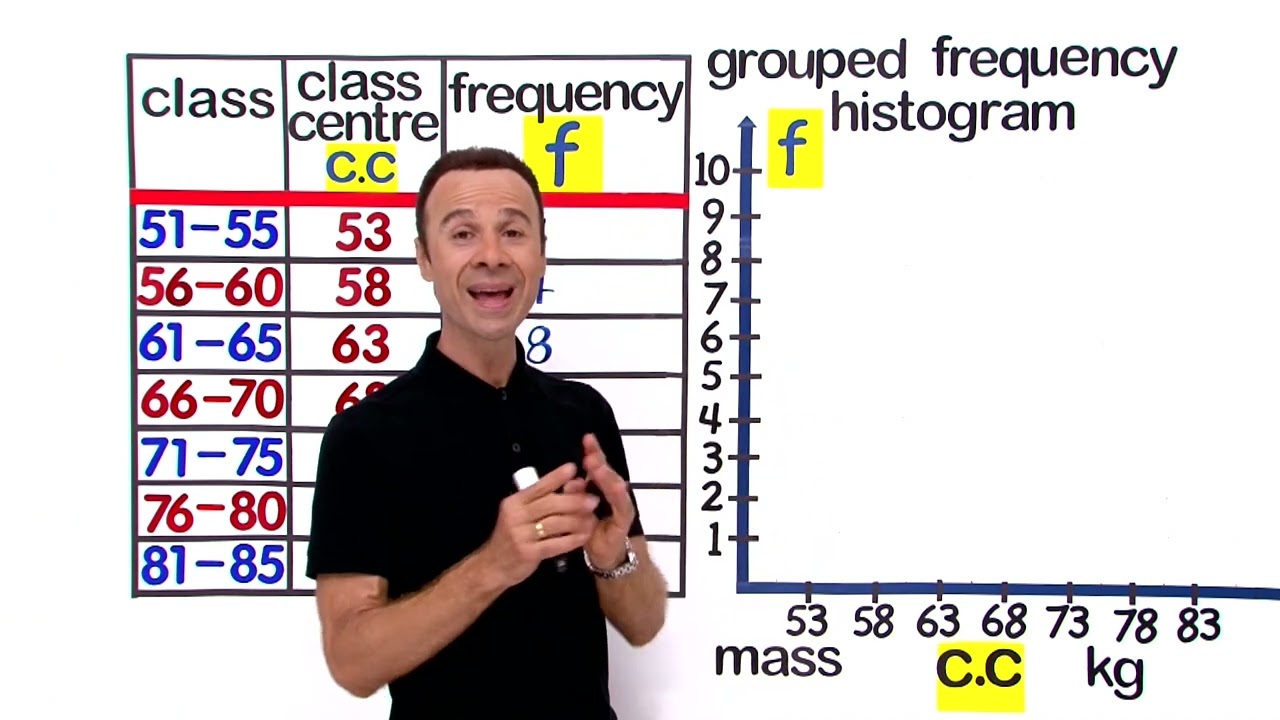
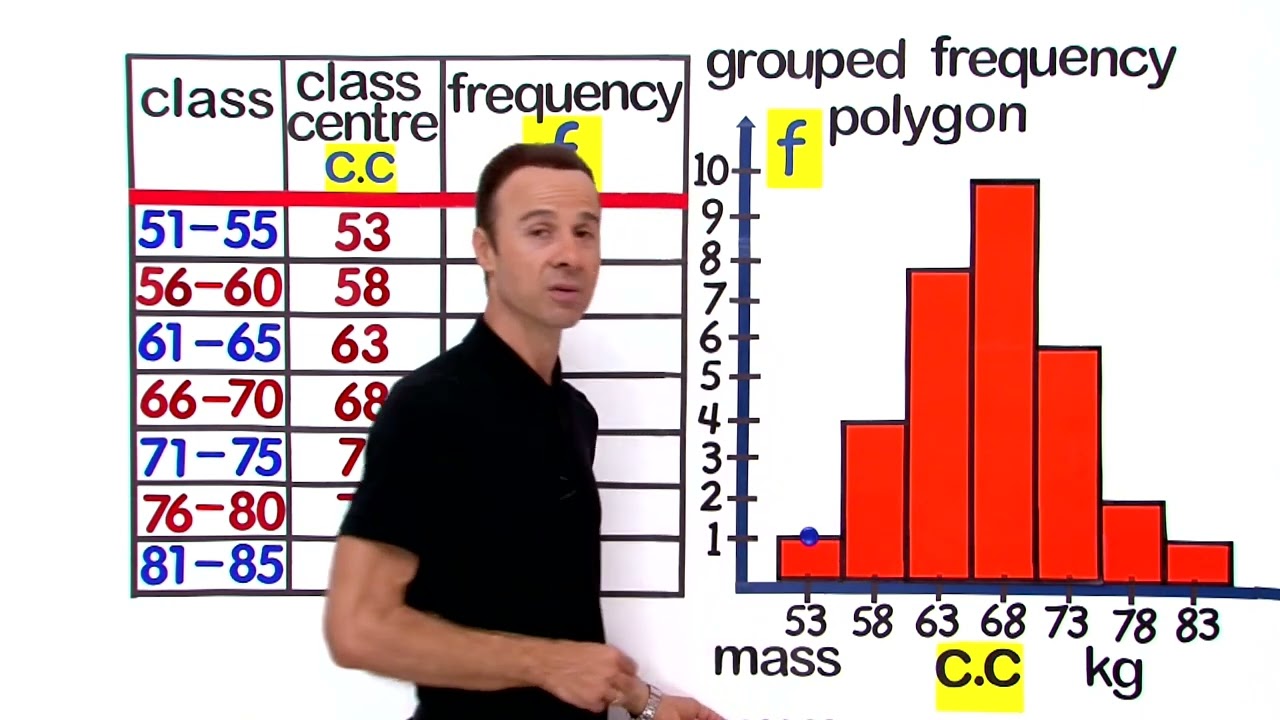
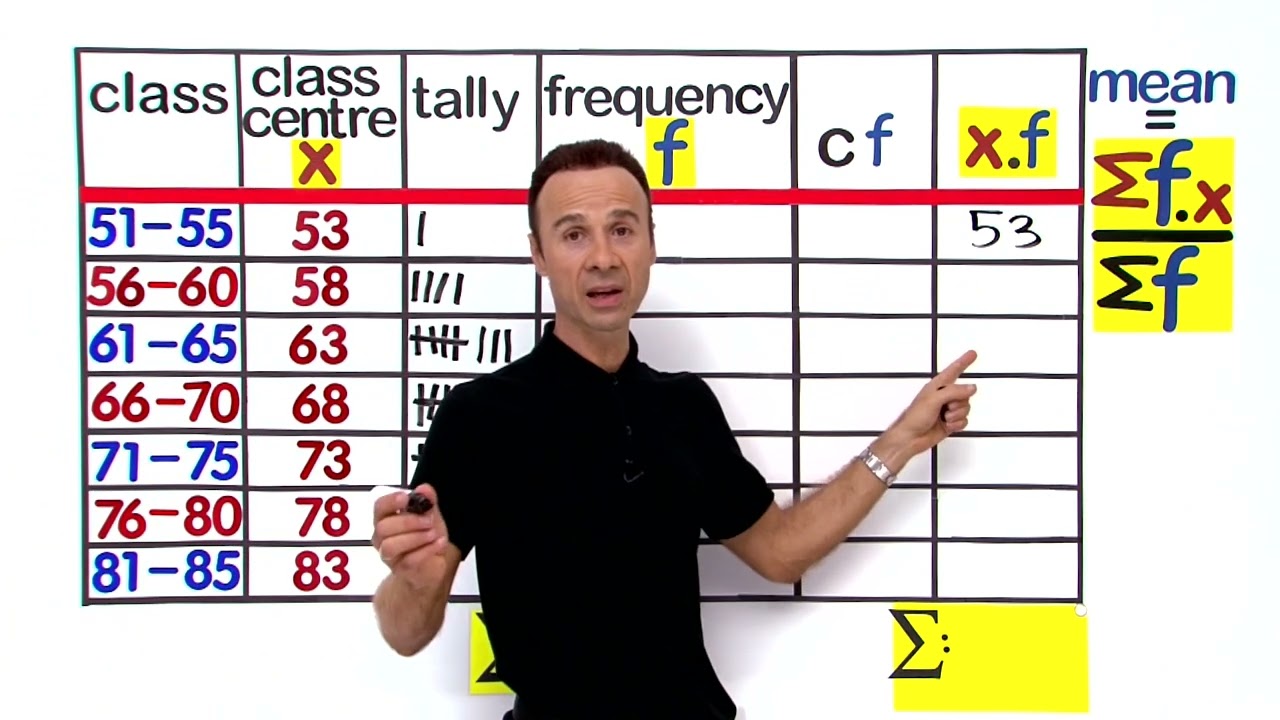
- Create Grouped Frequency Tables and Graphs
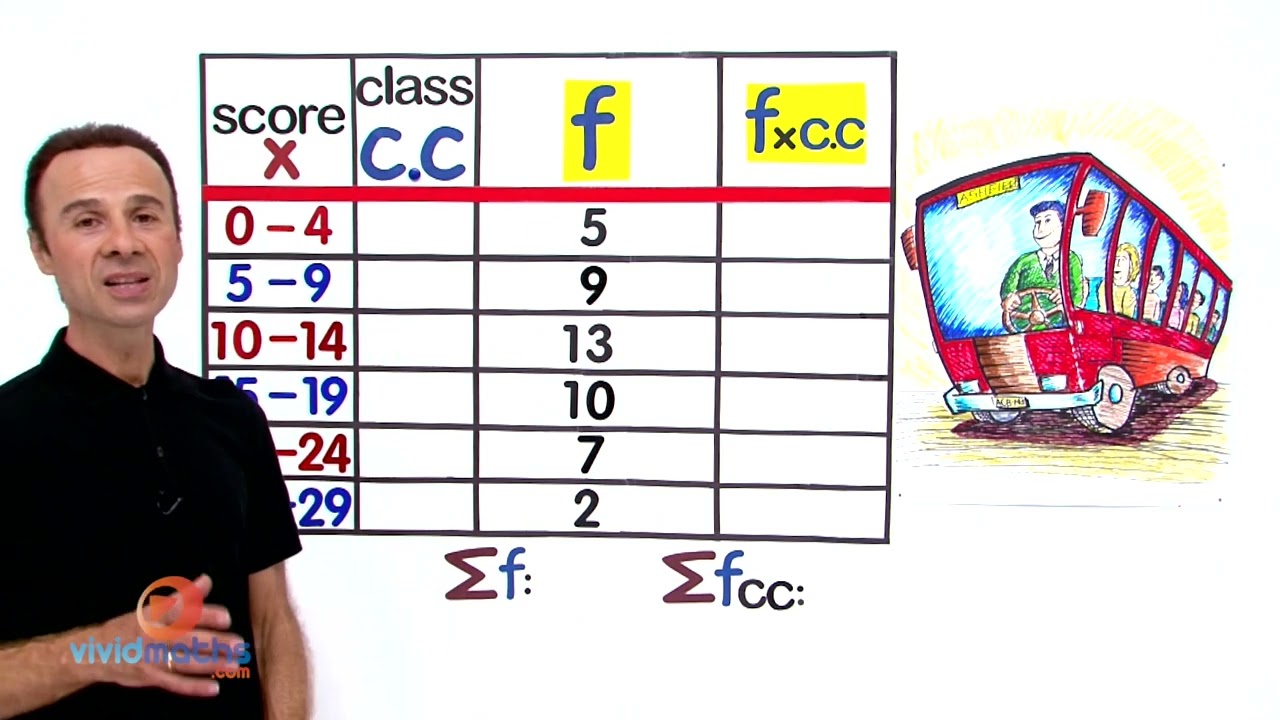
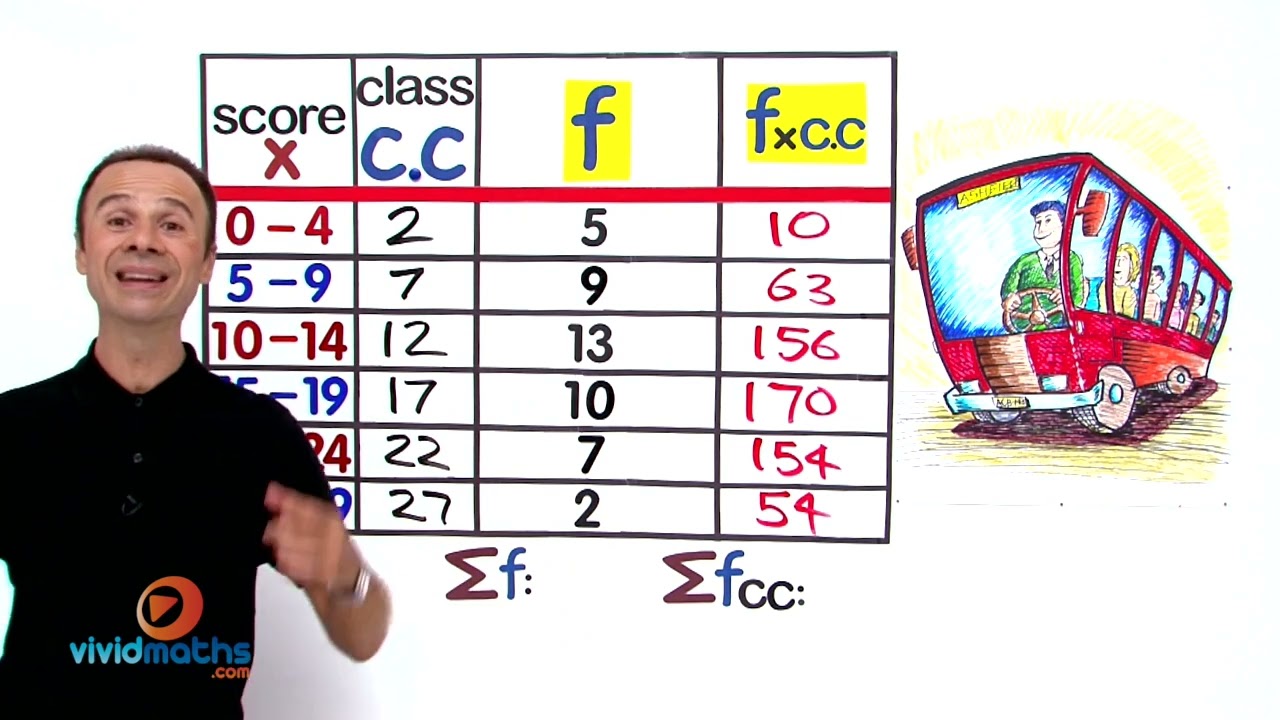
- Interpret Grouped Frequency Tables
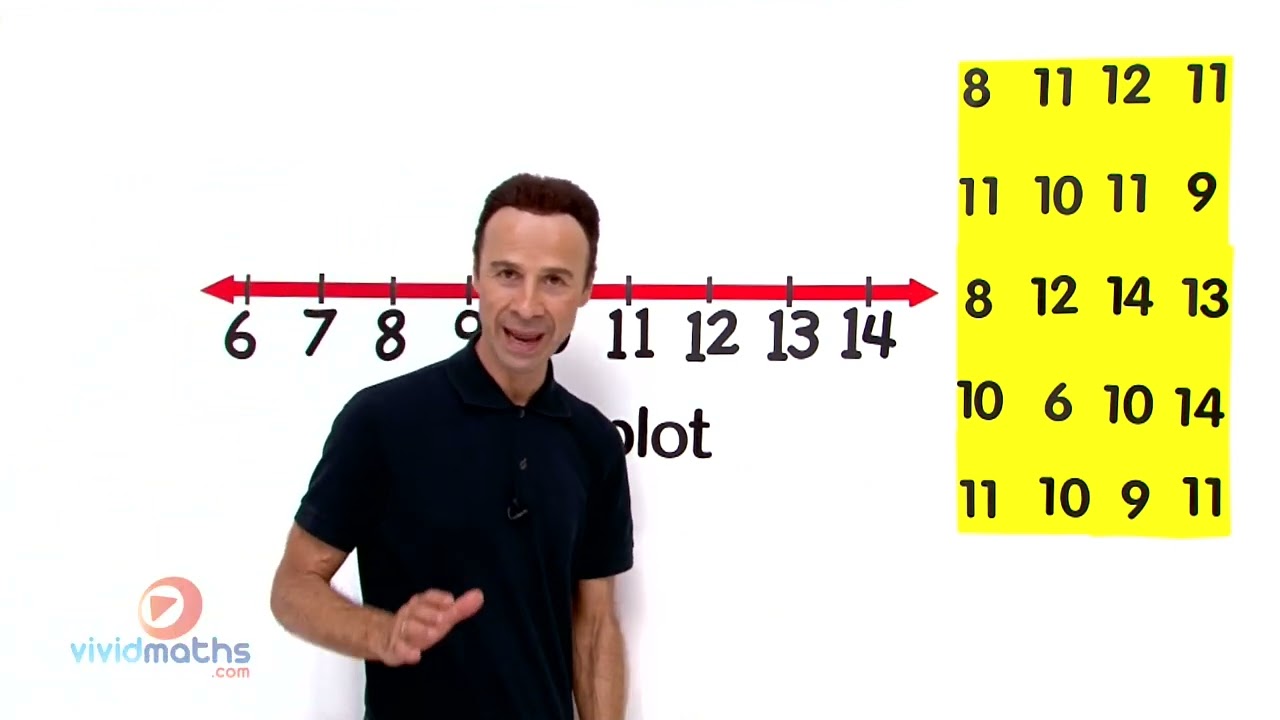
- Create and Interpret Dot Plots (Line Plots)
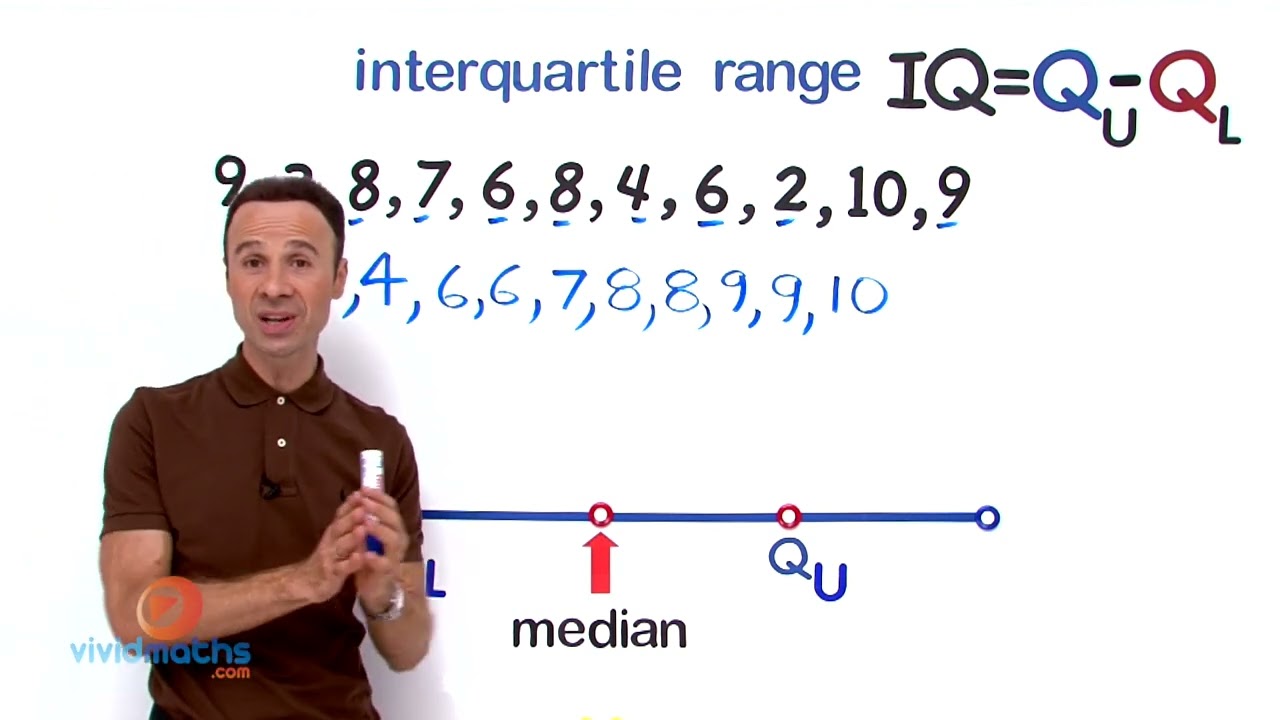
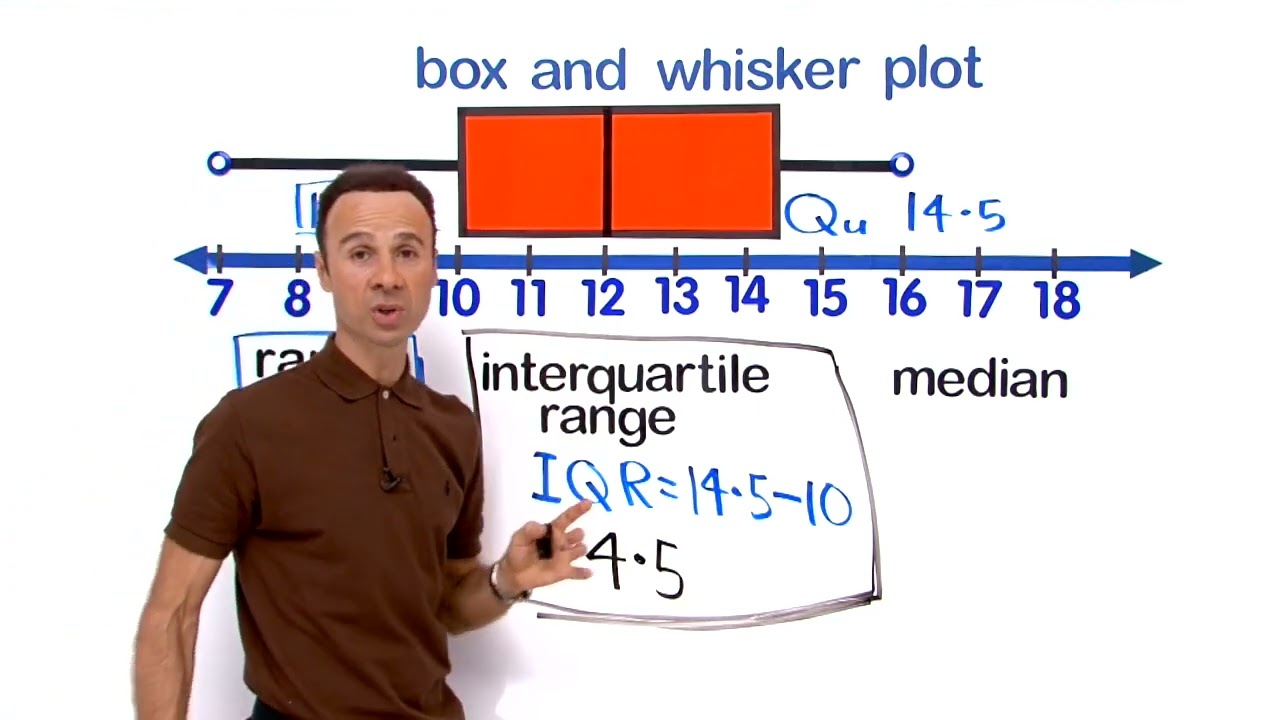
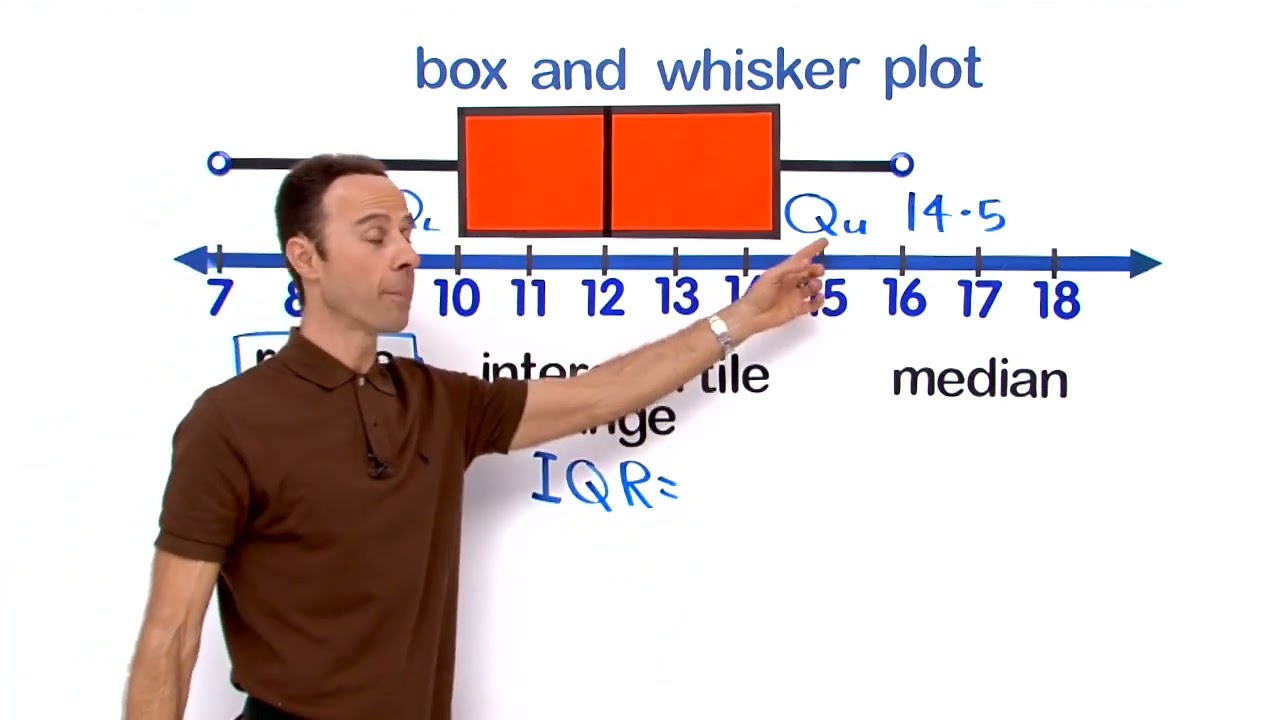
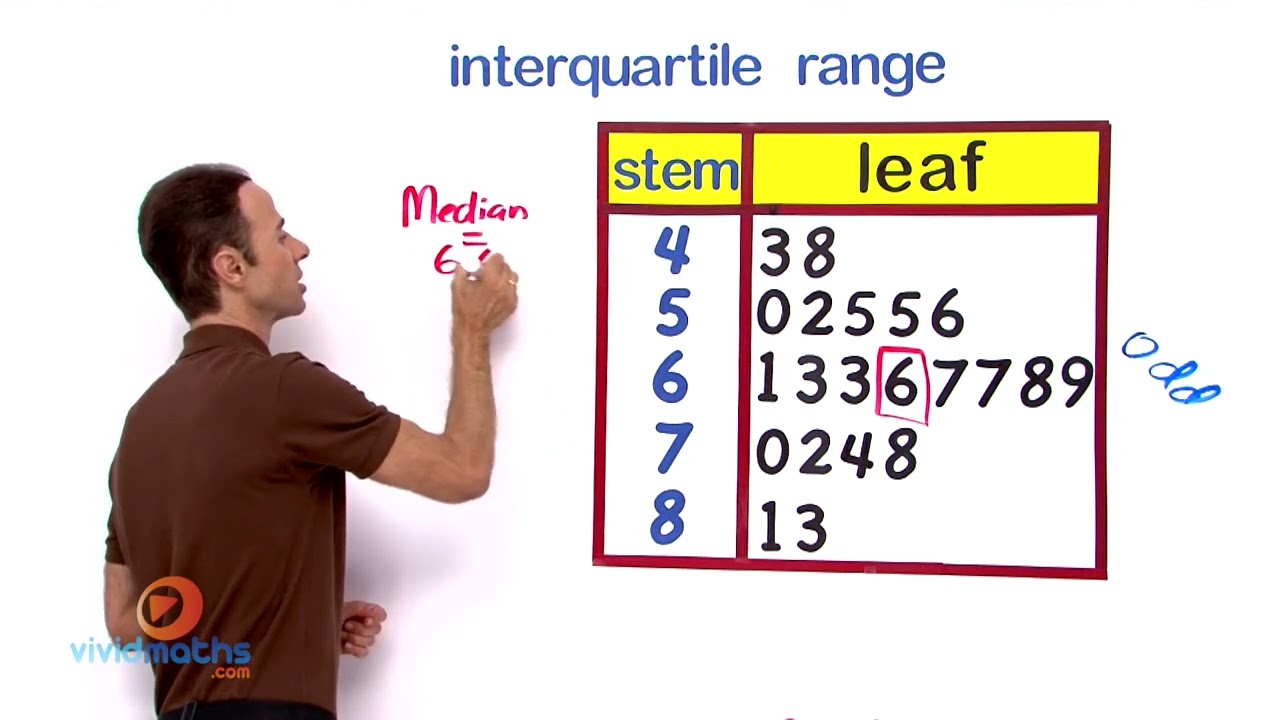
- Finding the Interquartile Range
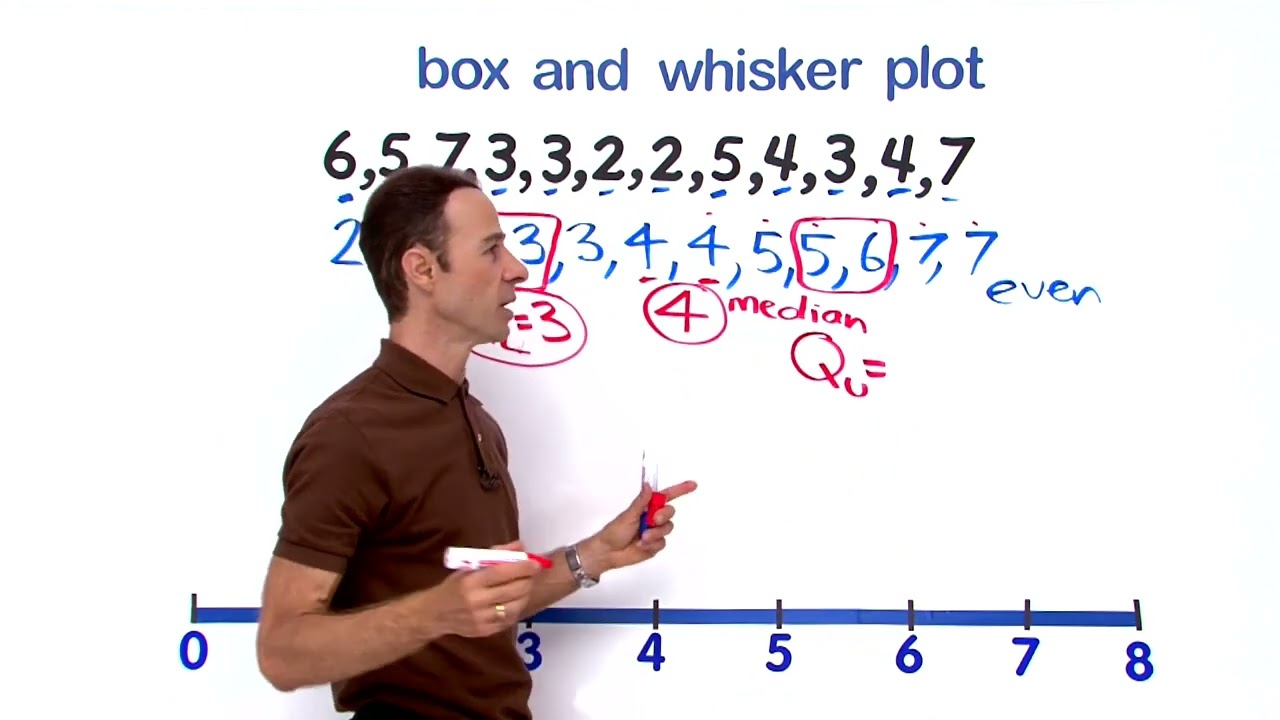
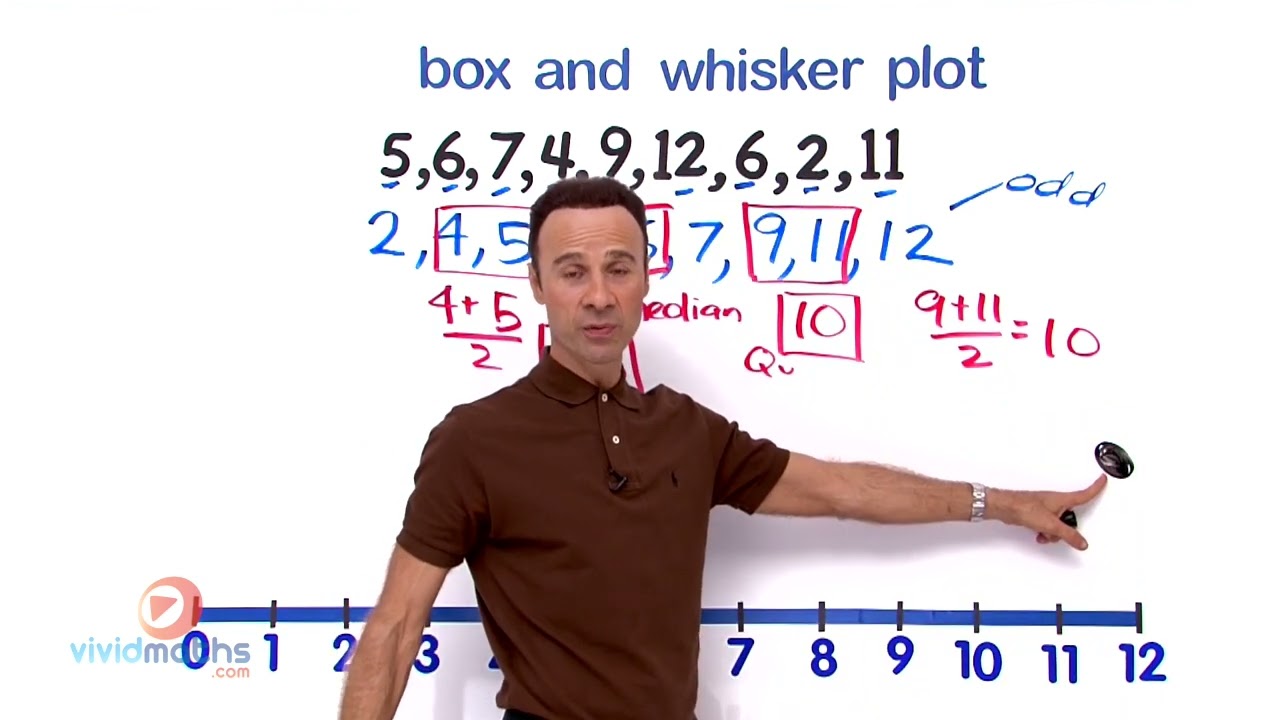
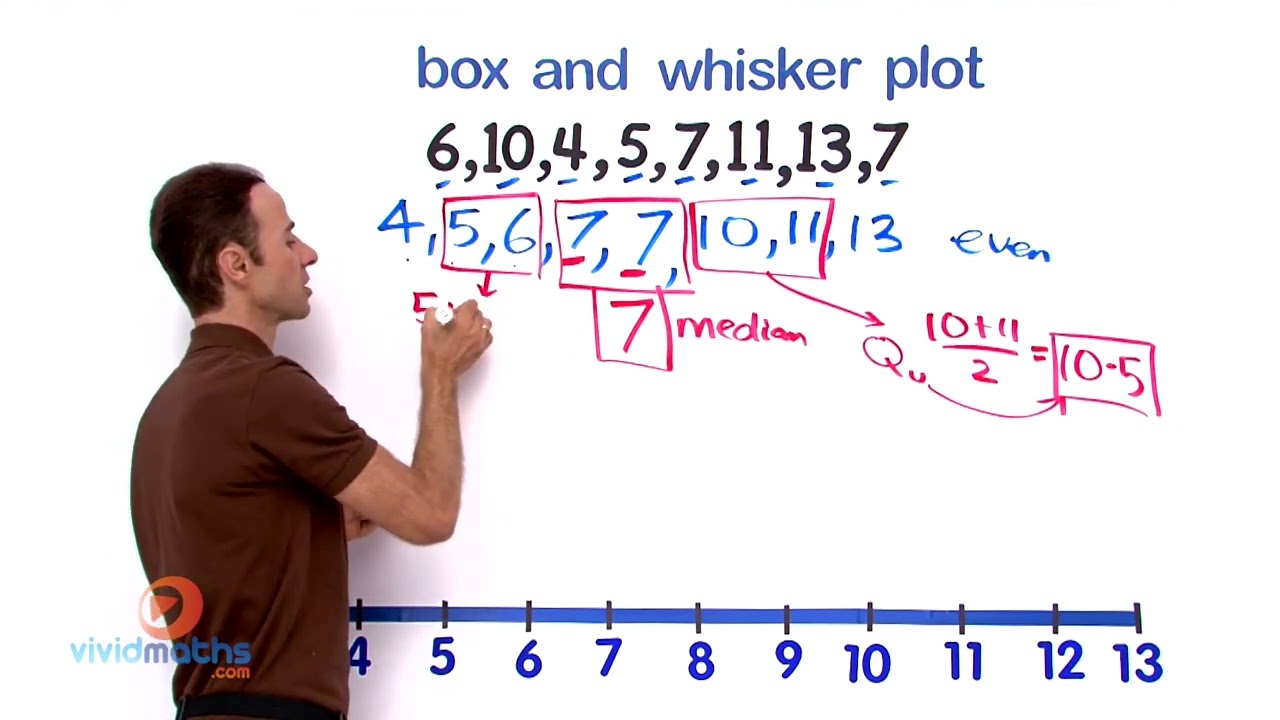
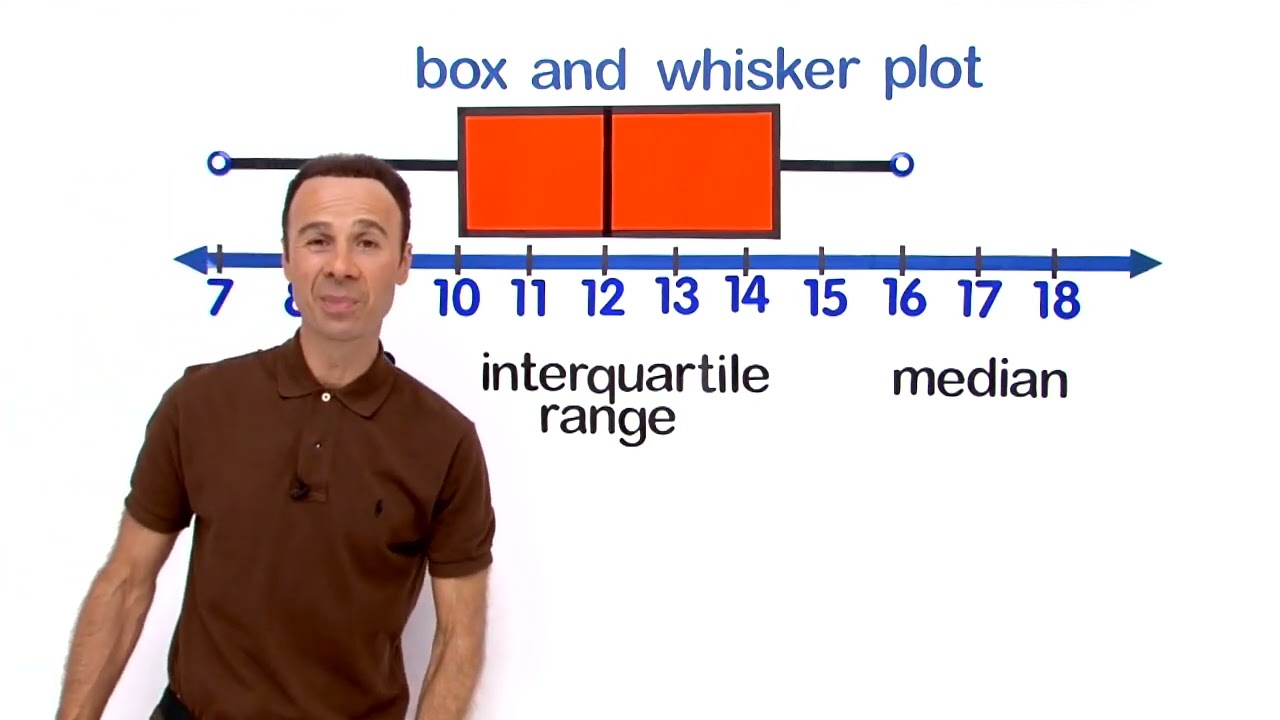
- Create and Interpret Box & Whisker Plots
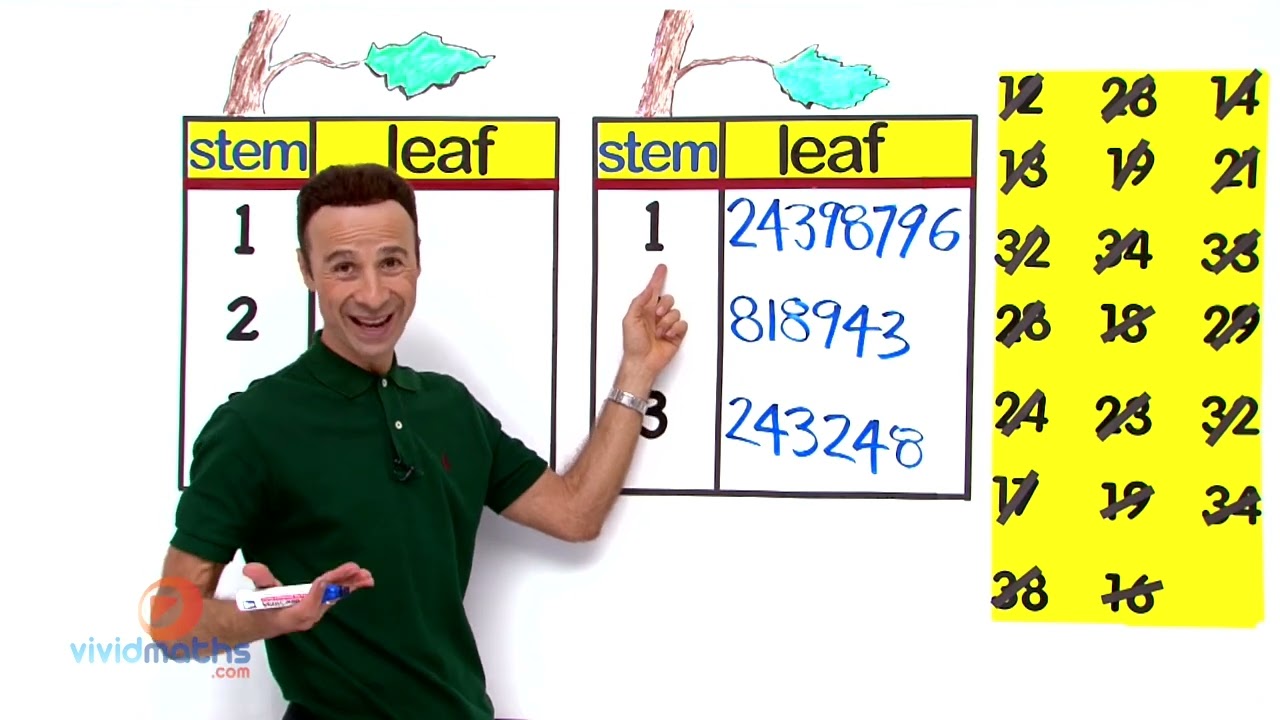
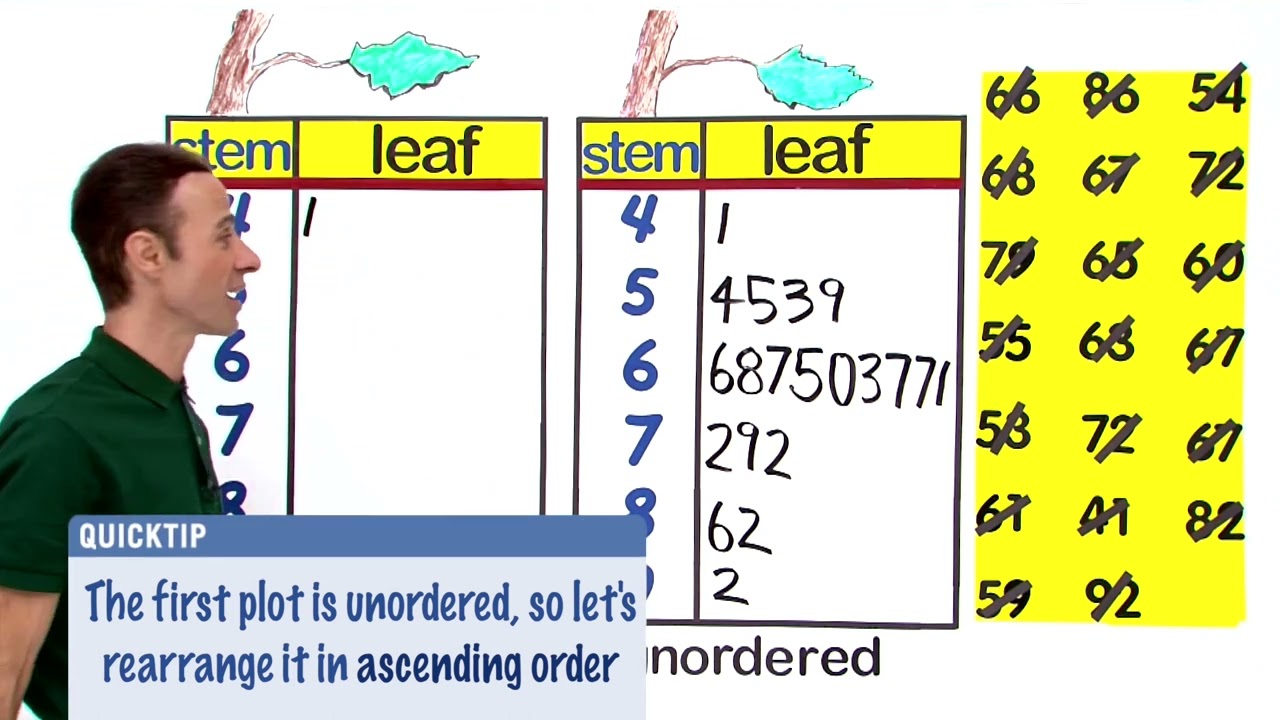
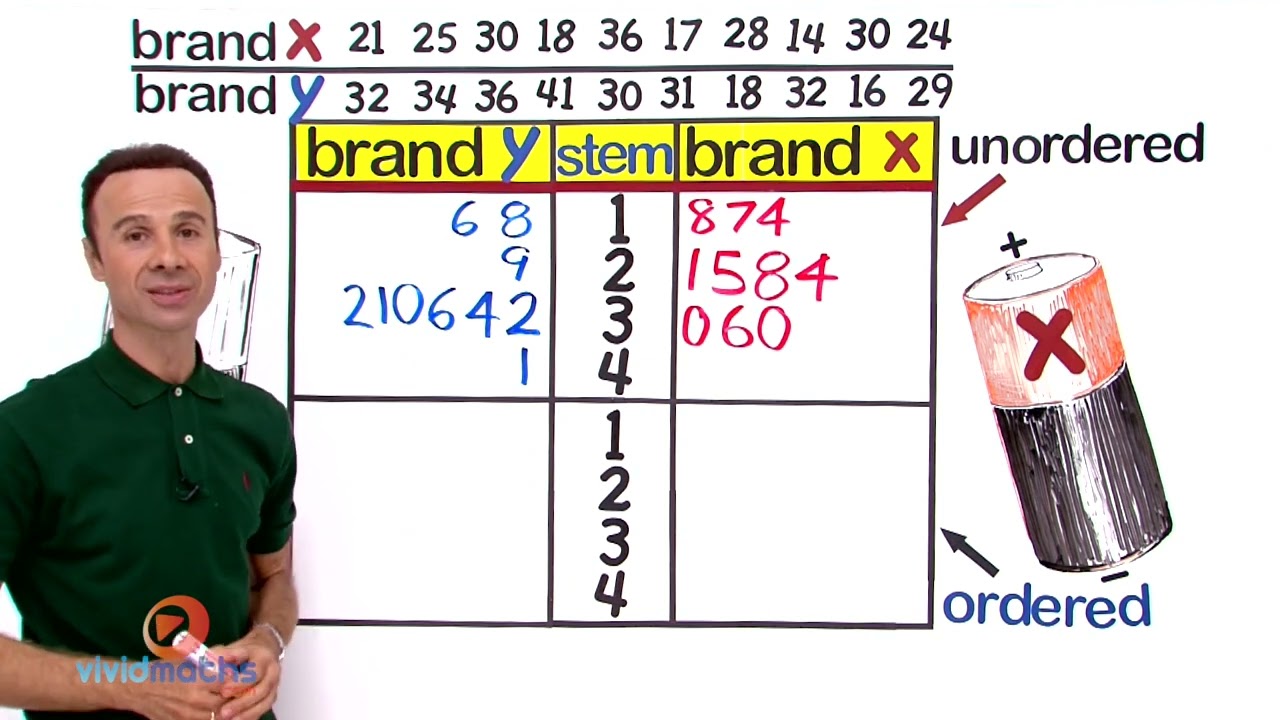
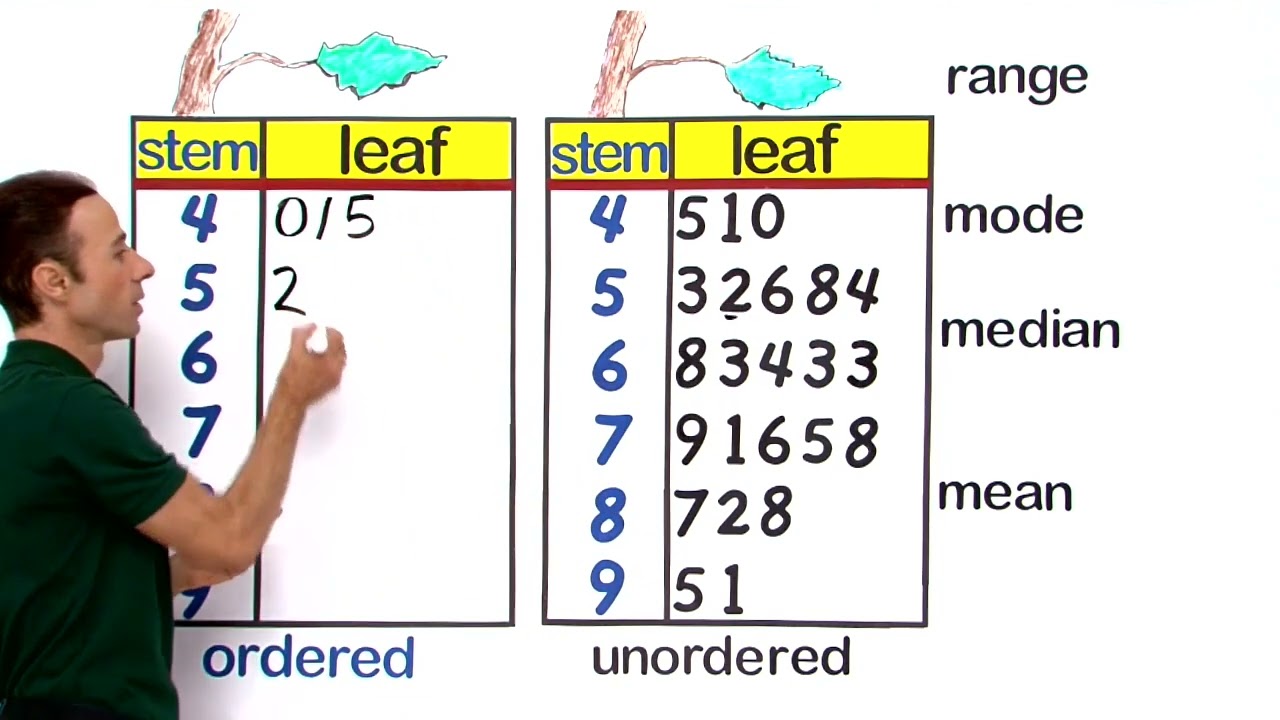
- Create and Interpret Stem & Leaf Plots