
You've reached your free lessons limit.
Unlock unlimited access for free with a
7-Day Free Trial.
What's Included
-
All course content from Years 7 - 12
-
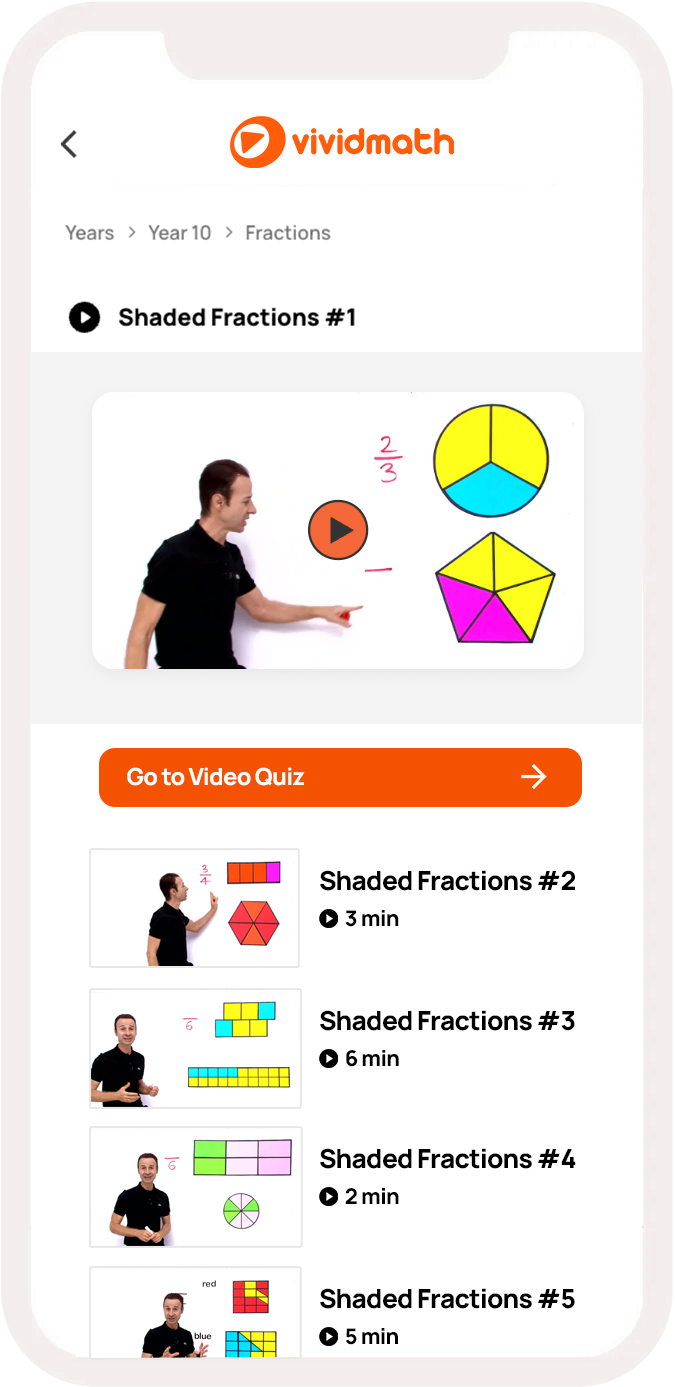
6,000+ step-by-step video lessons
-
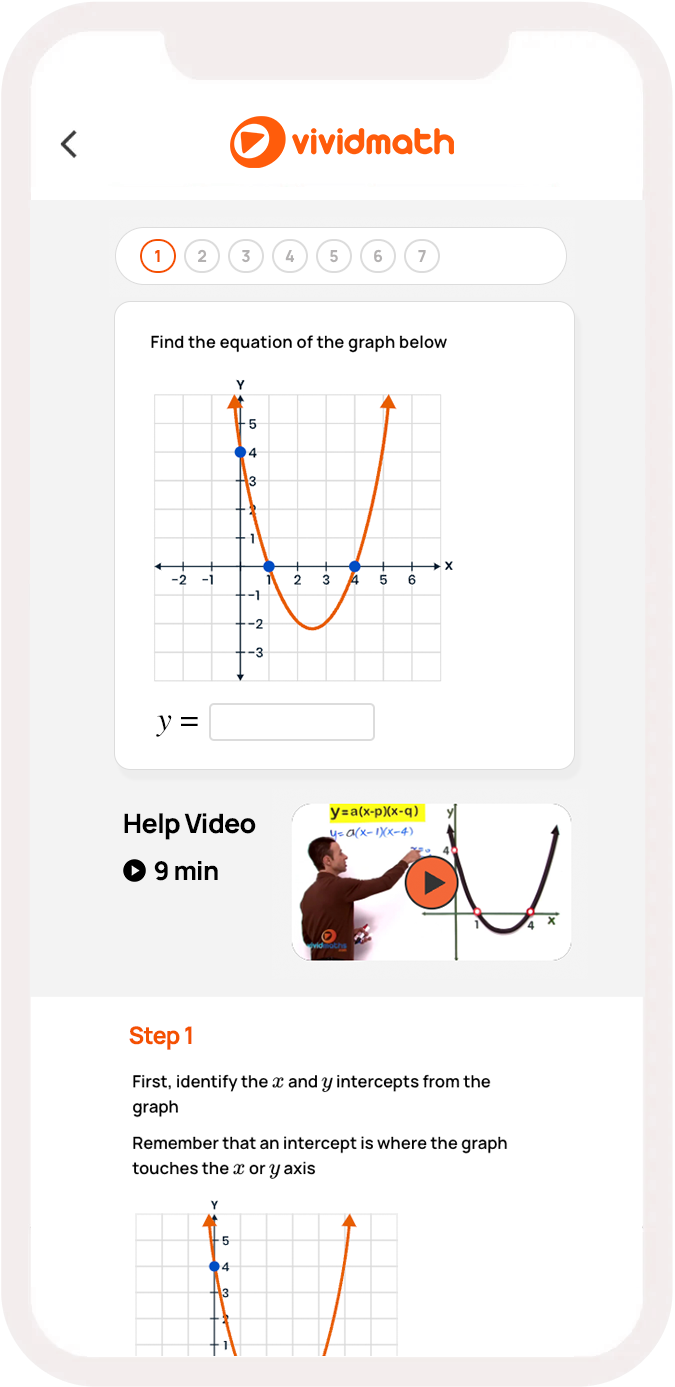
10,000+ guided practice exercises
-
Learn from your computer, phone or tablet
-
Personalised insights and reports
-
Australian aligned curriculum
-
24/7 support team on-hand
Choose a membership
-
Cancel anytime
-
60-Day Money Back Guarantee
Annual
12 months for the price of 8.
$14.99 AUD/month
$179.93 billed annually
Cancel anytime
Secured with SSL
Parents, teachers and students love VividMath.
Over 25 million lessons viewed.

Alex Merton-McCann
Jun 4, 2018

"Trying to help Mr 16 with maths today. Big shout out to @VividMaths for the great video tutorials! #grateful”

Melvin Ariano
Oct 24, 2023


“Learning on Vividmath has been great with my studies and has worked out much better for me than face to face tutoring. The customer support is awesome too."

Ruby King
Jan 02, 2020
"Thank you for these videos! I am a Math teacher. Right now all schools are on lock-down and we are distance teaching our students. I am asking my students to refer to your videos.
Patricia
Mar 30, 2024
"Vividmath has been a much better experience for me and my son than tutoring in the past. He’s able to learn in his own time and has performed better in his exams since signing him up. Positive experience overall."

John K.
Dec 12, 2022
"Vivid maths has enhanced my understanding in various maths topics and has given me the foundations to tackle harder problems. My marks have improved by 20%. The questions vary in difficulty, which allowed me to build the confidence to improve my abilities progressively. I consistently understand..."Read More

Lauren A.
a year ago
“Vividmath is a great resource. My 16 year old son uses vividmath a lot and he really enjoys it. It has been a real timesaver as we don’t have to worry about organising tutoring. Great for learning and practicing!”

Nivad Jagad
Mar 17, 2022
"Vividmath has been really helpful because everything is so well explained. Now I just so get it and can move on to the next question confidently."
Jan Dundas
Nov 10, 2021
"The program, in all categories, was relevant and easy to follow and remain focussed. The presentation was clear and able to be well comprehended. It is an amazing resource to enable easy access. It offers a positive experience for all."

Ruby
Nov 29, 2021
“I've been using vividmath for a couple of years now. It is super easy to use and I love that I'm able to find video lessons for each concept. All topics are covered in depth, which gave me a lot of confidence.”

Peter M.
27 Feb, 2022
"What an awesome way to learn math. Vividmath makes the concepts super easy to understand. The videos are very clear and the explanations are step by step which makes it so easy to follow."

Alex Nellie
a year ago
“Without a doubt one of the best platforms out there for math! The content is so comprehensive with so many videos for each topic. I've found VividMath to be very helpful with my homework and tests!”
Anija Paret
Sep 26, 2021
"My son is enjoying the way Vividmath works. He used to struggle and lack confidence in math and now he is so engaged, its really amazing to watch him grow in confidence."
Frequently Asked Questions.
Need more help? Contact us
General
-
What is VividMath?VividMath is an online maths platform that offers thousands of step-by-step video lessons taught by a real teacher and interactive practice exercises with instant video feedback.
-
Is my curriculum covered?All our lessons are structured according to the curriculum you are being taught at school.
-
Do I get access to all topics and years?Yes. After signing up to VividMath Premium you will be able to access all year levels and topics (all 6000 + lessons).
Pricing and Payments
-
How does the free trial work?When you sign up to any of our membership plans you get a 7-day no-risk free trial. You can cancel your membership anytime before the 7-day trial ends to avoid being charged.
-
How do I cancel my membership?You can choose to cancel your membership at anytime. Easily cancel online anytime in just two clicks.
-
How does the 60-day money back guarantee work?If for any reason you’re unhappy with your experience, you have a full 60 days to get reimbursed on any VividMath membership you choose. Just get in touch with our support team.
-
Is my payment secure?Yes. All payments are safeguarded with SSL technology, the most secure encryption technology currently available for electronic transactions.